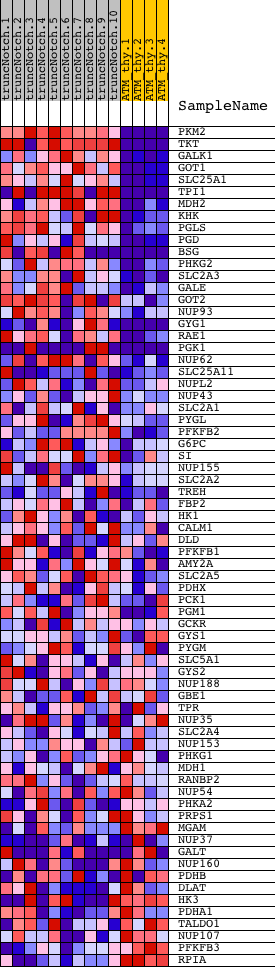
Profile of the Running ES Score & Positions of GeneSet Members on the Rank Ordered List
| Dataset | Set_03_truncNotch_versus_normalThy.phenotype_truncNotch_versus_normalThy.cls #truncNotch_versus_normalThy.phenotype_truncNotch_versus_normalThy.cls #truncNotch_versus_normalThy_repos |
| Phenotype | phenotype_truncNotch_versus_normalThy.cls#truncNotch_versus_normalThy_repos |
| Upregulated in class | truncNotch |
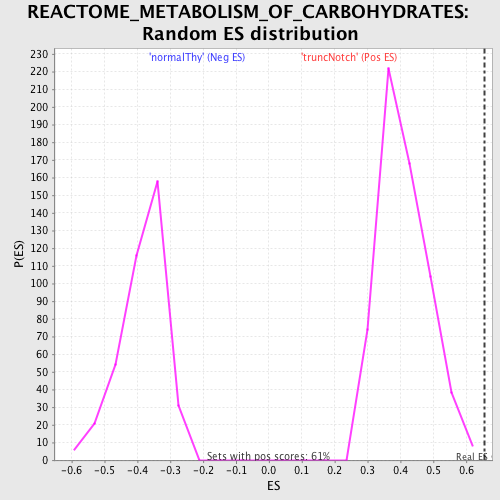
| GeneSet | REACTOME_METABOLISM_OF_CARBOHYDRATES |
| Enrichment Score (ES) | 0.65445083 |
| Normalized Enrichment Score (NES) | 1.6007514 |
| Nominal p-value | 0.0 |
| FDR q-value | 0.06509632 |
| FWER p-Value | 0.701 |
| PROBE | DESCRIPTION (from dataset) | GENE SYMBOL | GENE_TITLE | RANK IN GENE LIST | RANK METRIC SCORE | RUNNING ES | CORE ENRICHMENT | |
|---|---|---|---|---|---|---|---|---|
| 1 | PKM2 | 6520403 70500 | 8 | 11.751 | 0.1127 | Yes | ||
| 2 | TKT | 6590064 6860039 | 33 | 8.882 | 0.1969 | Yes | ||
| 3 | GALK1 | 840162 | 334 | 4.994 | 0.2288 | Yes | ||
| 4 | GOT1 | 2940465 | 372 | 4.801 | 0.2730 | Yes | ||
| 5 | SLC25A1 | 4050402 | 388 | 4.747 | 0.3179 | Yes | ||
| 6 | TPI1 | 1500215 2100154 | 397 | 4.690 | 0.3627 | Yes | ||
| 7 | MDH2 | 1850601 | 514 | 4.312 | 0.3979 | Yes | ||
| 8 | KHK | 1090204 3870204 | 628 | 3.929 | 0.4296 | Yes | ||
| 9 | PGLS | 2120324 | 922 | 3.187 | 0.4445 | Yes | ||
| 10 | PGD | 6840048 | 1033 | 2.976 | 0.4672 | Yes | ||
| 11 | BSG | 2900193 6520053 | 1063 | 2.933 | 0.4939 | Yes | ||
| 12 | PHKG2 | 2640148 | 1064 | 2.932 | 0.5221 | Yes | ||
| 13 | SLC2A3 | 1990377 | 1119 | 2.834 | 0.5465 | Yes | ||
| 14 | GALE | 3610400 6290072 | 1120 | 2.833 | 0.5738 | Yes | ||
| 15 | GOT2 | 4570164 5220450 | 1424 | 2.366 | 0.5802 | Yes | ||
| 16 | NUP93 | 2190273 | 1578 | 2.168 | 0.5929 | Yes | ||
| 17 | GYG1 | 460746 1450138 | 1638 | 2.087 | 0.6098 | Yes | ||
| 18 | RAE1 | 7050121 | 1639 | 2.082 | 0.6298 | Yes | ||
| 19 | PGK1 | 1570494 630300 | 1768 | 1.961 | 0.6418 | Yes | ||
| 20 | NUP62 | 1240128 | 1866 | 1.857 | 0.6545 | Yes | ||
| 21 | SLC25A11 | 130097 770685 | 2424 | 1.283 | 0.6368 | No | ||
| 22 | NUPL2 | 6550537 | 2739 | 1.030 | 0.6298 | No | ||
| 23 | NUP43 | 3360482 | 2905 | 0.945 | 0.6300 | No | ||
| 24 | SLC2A1 | 2100609 | 3116 | 0.805 | 0.6264 | No | ||
| 25 | PYGL | 7160520 | 3456 | 0.621 | 0.6141 | No | ||
| 26 | PFKFB2 | 3940538 7100059 | 3528 | 0.590 | 0.6159 | No | ||
| 27 | G6PC | 430093 | 3648 | 0.539 | 0.6147 | No | ||
| 28 | SI | 730167 2260609 | 3677 | 0.532 | 0.6183 | No | ||
| 29 | NUP155 | 5720576 6220114 | 4413 | 0.333 | 0.5819 | No | ||
| 30 | SLC2A2 | 5130537 5720722 6770079 | 4454 | 0.326 | 0.5829 | No | ||
| 31 | TREH | 630079 | 4526 | 0.312 | 0.5820 | No | ||
| 32 | FBP2 | 1580193 | 5642 | 0.169 | 0.5236 | No | ||
| 33 | HK1 | 4280402 | 5684 | 0.164 | 0.5229 | No | ||
| 34 | CALM1 | 380128 | 6240 | 0.121 | 0.4942 | No | ||
| 35 | DLD | 4150403 6590341 | 6289 | 0.118 | 0.4927 | No | ||
| 36 | PFKFB1 | 2370128 | 6572 | 0.105 | 0.4785 | No | ||
| 37 | AMY2A | 580138 | 6674 | 0.099 | 0.4740 | No | ||
| 38 | SLC2A5 | 670273 | 7281 | 0.074 | 0.4421 | No | ||
| 39 | PDHX | 870315 | 7638 | 0.064 | 0.4235 | No | ||
| 40 | PCK1 | 7000358 | 7734 | 0.061 | 0.4190 | No | ||
| 41 | PGM1 | 3840408 | 8006 | 0.054 | 0.4049 | No | ||
| 42 | GCKR | 4070035 | 9641 | 0.021 | 0.3170 | No | ||
| 43 | GYS1 | 540154 | 9912 | 0.017 | 0.3026 | No | ||
| 44 | PYGM | 3940300 | 10158 | 0.013 | 0.2895 | No | ||
| 45 | SLC5A1 | 2470053 | 10735 | 0.003 | 0.2585 | No | ||
| 46 | GYS2 | 2570736 | 10777 | 0.002 | 0.2563 | No | ||
| 47 | NUP188 | 1190470 | 10849 | 0.001 | 0.2525 | No | ||
| 48 | GBE1 | 2190368 | 11104 | -0.003 | 0.2388 | No | ||
| 49 | TPR | 1990066 6550390 | 11115 | -0.003 | 0.2383 | No | ||
| 50 | NUP35 | 5340408 | 11414 | -0.009 | 0.2223 | No | ||
| 51 | SLC2A4 | 540441 | 11889 | -0.018 | 0.1969 | No | ||
| 52 | NUP153 | 7000452 | 12122 | -0.023 | 0.1846 | No | ||
| 53 | PHKG1 | 2570152 | 12679 | -0.037 | 0.1550 | No | ||
| 54 | MDH1 | 6660358 6760731 | 12975 | -0.046 | 0.1396 | No | ||
| 55 | RANBP2 | 4280338 | 13334 | -0.062 | 0.1208 | No | ||
| 56 | NUP54 | 940546 2360156 4060278 | 13732 | -0.086 | 0.1003 | No | ||
| 57 | PHKA2 | 610035 1090044 | 14398 | -0.159 | 0.0659 | No | ||
| 58 | PRPS1 | 6350129 | 14534 | -0.186 | 0.0605 | No | ||
| 59 | MGAM | 2510438 | 14869 | -0.276 | 0.0451 | No | ||
| 60 | NUP37 | 2370097 6370435 6380008 | 15445 | -0.499 | 0.0189 | No | ||
| 61 | GALT | 3710162 5550075 | 15633 | -0.595 | 0.0146 | No | ||
| 62 | NUP160 | 1990551 | 15736 | -0.658 | 0.0154 | No | ||
| 63 | PDHB | 70215 610086 | 15820 | -0.698 | 0.0176 | No | ||
| 64 | DLAT | 430452 | 16144 | -0.926 | 0.0091 | No | ||
| 65 | HK3 | 3190288 6510142 | 16187 | -0.956 | 0.0161 | No | ||
| 66 | PDHA1 | 5550397 | 16299 | -1.004 | 0.0198 | No | ||
| 67 | TALDO1 | 940400 | 16771 | -1.466 | 0.0085 | No | ||
| 68 | NUP107 | 6380021 | 17184 | -1.940 | 0.0049 | No | ||
| 69 | PFKFB3 | 630706 | 17720 | -2.857 | 0.0036 | No | ||
| 70 | RPIA | 780079 | 18281 | -4.639 | 0.0181 | No |