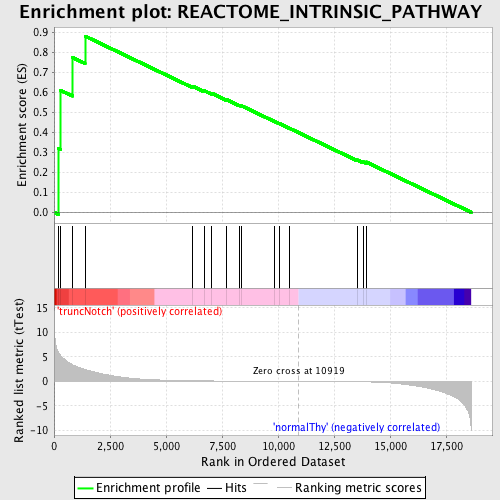
Profile of the Running ES Score & Positions of GeneSet Members on the Rank Ordered List
| Dataset | Set_03_truncNotch_versus_normalThy.phenotype_truncNotch_versus_normalThy.cls #truncNotch_versus_normalThy.phenotype_truncNotch_versus_normalThy.cls #truncNotch_versus_normalThy_repos |
| Phenotype | phenotype_truncNotch_versus_normalThy.cls#truncNotch_versus_normalThy_repos |
| Upregulated in class | truncNotch |
| GeneSet | REACTOME_INTRINSIC_PATHWAY |
| Enrichment Score (ES) | 0.882357 |
| Normalized Enrichment Score (NES) | 1.6460041 |
| Nominal p-value | 0.0 |
| FDR q-value | 0.04620197 |
| FWER p-Value | 0.379 |
| PROBE | DESCRIPTION (from dataset) | GENE SYMBOL | GENE_TITLE | RANK IN GENE LIST | RANK METRIC SCORE | RUNNING ES | CORE ENRICHMENT | |
|---|---|---|---|---|---|---|---|---|
| 1 | F2 | 5720280 | 204 | 5.849 | 0.3195 | Yes | ||
| 2 | C1QBP | 3170452 | 295 | 5.228 | 0.6101 | Yes | ||
| 3 | F10 | 3830450 | 814 | 3.422 | 0.7757 | Yes | ||
| 4 | SERPING1 | 5550440 | 1381 | 2.426 | 0.8824 | Yes | ||
| 5 | F11 | 6370577 6510373 | 6170 | 0.126 | 0.6321 | No | ||
| 6 | GP5 | 2510088 | 6703 | 0.098 | 0.6090 | No | ||
| 7 | KNG1 | 6400576 6770347 | 7024 | 0.084 | 0.5966 | No | ||
| 8 | GP9 | 1190181 | 7683 | 0.063 | 0.5648 | No | ||
| 9 | F12 | 1090215 3520736 | 8258 | 0.048 | 0.5366 | No | ||
| 10 | F9 | 3190154 | 8373 | 0.045 | 0.5330 | No | ||
| 11 | F8 | 2190647 2340465 | 9820 | 0.018 | 0.4563 | No | ||
| 12 | A2M | 6620039 | 10071 | 0.014 | 0.4437 | No | ||
| 13 | GP1BB | 3780075 | 10491 | 0.007 | 0.4216 | No | ||
| 14 | VWF | 4670519 | 13535 | -0.073 | 0.2621 | No | ||
| 15 | KLKB1 | 5390446 | 13815 | -0.093 | 0.2523 | No | ||
| 16 | GP1BA | 6590372 | 13929 | -0.101 | 0.2520 | No |

