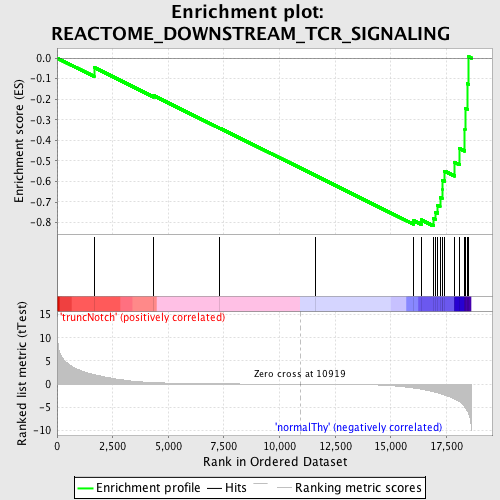
Profile of the Running ES Score & Positions of GeneSet Members on the Rank Ordered List
| Dataset | Set_03_truncNotch_versus_normalThy.phenotype_truncNotch_versus_normalThy.cls #truncNotch_versus_normalThy.phenotype_truncNotch_versus_normalThy.cls #truncNotch_versus_normalThy_repos |
| Phenotype | phenotype_truncNotch_versus_normalThy.cls#truncNotch_versus_normalThy_repos |
| Upregulated in class | normalThy |
| GeneSet | REACTOME_DOWNSTREAM_TCR_SIGNALING |
| Enrichment Score (ES) | -0.81661063 |
| Normalized Enrichment Score (NES) | -1.6555238 |
| Nominal p-value | 0.0024271845 |
| FDR q-value | 0.11295152 |
| FWER p-Value | 0.54 |
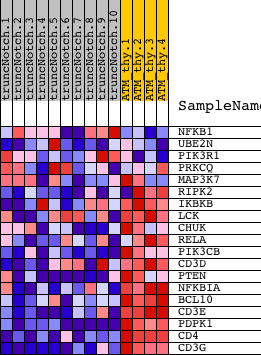
| PROBE | DESCRIPTION (from dataset) | GENE SYMBOL | GENE_TITLE | RANK IN GENE LIST | RANK METRIC SCORE | RUNNING ES | CORE ENRICHMENT | |
|---|---|---|---|---|---|---|---|---|
| 1 | NFKB1 | 5420358 | 1663 | 2.059 | -0.0456 | No | ||
| 2 | UBE2N | 520369 2900047 | 4340 | 0.345 | -0.1822 | No | ||
| 3 | PIK3R1 | 4730671 | 7309 | 0.074 | -0.3402 | No | ||
| 4 | PRKCQ | 2260170 3870193 | 11611 | -0.012 | -0.5712 | No | ||
| 5 | MAP3K7 | 6040068 | 16007 | -0.821 | -0.7900 | Yes | ||
| 6 | RIPK2 | 5050072 6290632 | 16369 | -1.063 | -0.7868 | Yes | ||
| 7 | IKBKB | 6840072 | 16924 | -1.659 | -0.7813 | Yes | ||
| 8 | LCK | 3360142 | 17003 | -1.730 | -0.7487 | Yes | ||
| 9 | CHUK | 7050736 | 17108 | -1.856 | -0.7148 | Yes | ||
| 10 | RELA | 3830075 | 17212 | -1.973 | -0.6784 | Yes | ||
| 11 | PIK3CB | 3800600 | 17306 | -2.122 | -0.6382 | Yes | ||
| 12 | CD3D | 2810739 | 17311 | -2.126 | -0.5932 | Yes | ||
| 13 | PTEN | 3390064 | 17414 | -2.288 | -0.5500 | Yes | ||
| 14 | NFKBIA | 1570152 | 17856 | -3.162 | -0.5065 | Yes | ||
| 15 | BCL10 | 2360397 | 18081 | -3.744 | -0.4388 | Yes | ||
| 16 | CD3E | 3800056 | 18329 | -4.901 | -0.3479 | Yes | ||
| 17 | PDPK1 | 6650168 | 18338 | -4.943 | -0.2431 | Yes | ||
| 18 | CD4 | 1090010 | 18448 | -5.828 | -0.1250 | Yes | ||
| 19 | CD3G | 2680288 | 18503 | -6.298 | 0.0061 | Yes |