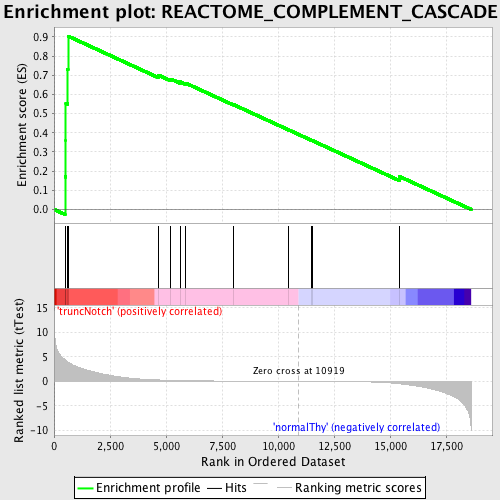
Profile of the Running ES Score & Positions of GeneSet Members on the Rank Ordered List
| Dataset | Set_03_truncNotch_versus_normalThy.phenotype_truncNotch_versus_normalThy.cls #truncNotch_versus_normalThy.phenotype_truncNotch_versus_normalThy.cls #truncNotch_versus_normalThy_repos |
| Phenotype | phenotype_truncNotch_versus_normalThy.cls#truncNotch_versus_normalThy_repos |
| Upregulated in class | truncNotch |
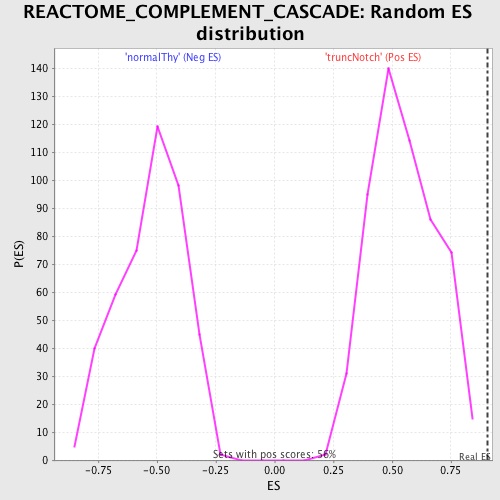
| GeneSet | REACTOME_COMPLEMENT_CASCADE |
| Enrichment Score (ES) | 0.9044996 |
| Normalized Enrichment Score (NES) | 1.647769 |
| Nominal p-value | 0.0 |
| FDR q-value | 0.049965333 |
| FWER p-Value | 0.372 |
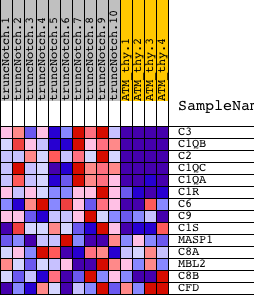
| PROBE | DESCRIPTION (from dataset) | GENE SYMBOL | GENE_TITLE | RANK IN GENE LIST | RANK METRIC SCORE | RUNNING ES | CORE ENRICHMENT | |
|---|---|---|---|---|---|---|---|---|
| 1 | C3 | 1740372 | 490 | 4.389 | 0.1707 | Yes | ||
| 2 | C1QB | 5910292 | 523 | 4.289 | 0.3616 | Yes | ||
| 3 | C2 | 5390465 | 527 | 4.282 | 0.5537 | Yes | ||
| 4 | C1QC | 5700131 | 600 | 3.989 | 0.7289 | Yes | ||
| 5 | C1QA | 5390687 | 622 | 3.936 | 0.9045 | Yes | ||
| 6 | C1R | 2340025 3290152 4850452 | 4647 | 0.291 | 0.7013 | No | ||
| 7 | C6 | 1770154 2900129 | 5212 | 0.212 | 0.6805 | No | ||
| 8 | C9 | 5550452 5690253 | 5619 | 0.171 | 0.6663 | No | ||
| 9 | C1S | 840184 6840114 | 5875 | 0.146 | 0.6592 | No | ||
| 10 | MASP1 | 1780619 2900066 | 8003 | 0.054 | 0.5473 | No | ||
| 11 | C8A | 2190601 | 10478 | 0.008 | 0.4146 | No | ||
| 12 | MBL2 | 6370446 | 11484 | -0.010 | 0.3611 | No | ||
| 13 | C8B | 6770687 | 11520 | -0.010 | 0.3596 | No | ||
| 14 | CFD | 2320736 | 15415 | -0.484 | 0.1721 | No |