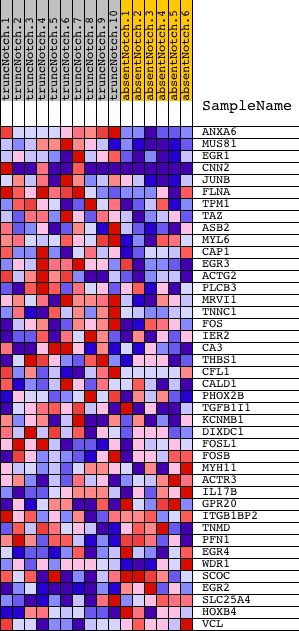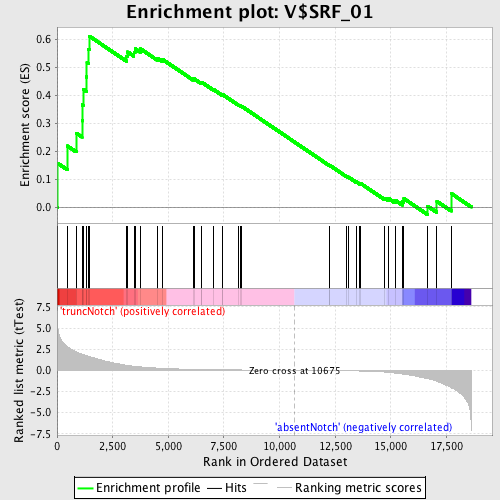
Profile of the Running ES Score & Positions of GeneSet Members on the Rank Ordered List
| Dataset | Set_03_absentNotch_versus_truncNotch.phenotype_absentNotch_versus_truncNotch.cls #truncNotch_versus_absentNotch |
| Phenotype | phenotype_absentNotch_versus_truncNotch.cls#truncNotch_versus_absentNotch |
| Upregulated in class | truncNotch |
| GeneSet | V$SRF_01 |
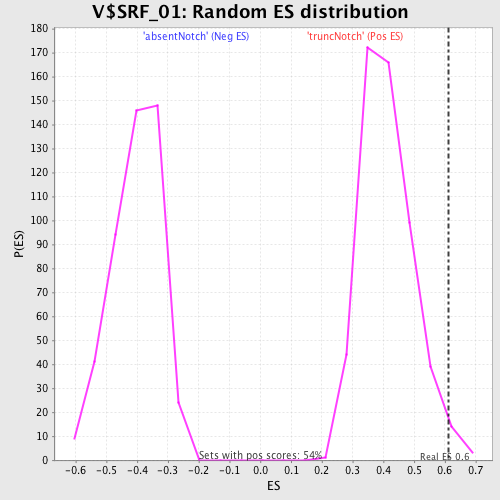
| Enrichment Score (ES) | 0.61074275 |
| Normalized Enrichment Score (NES) | 1.4812768 |
| Nominal p-value | 0.01858736 |
| FDR q-value | 0.6191826 |
| FWER p-Value | 0.928 |
| PROBE | DESCRIPTION (from dataset) | GENE SYMBOL | GENE_TITLE | RANK IN GENE LIST | RANK METRIC SCORE | RUNNING ES | CORE ENRICHMENT | |
|---|---|---|---|---|---|---|---|---|
| 1 | ANXA6 | 2190014 | 30 | 5.135 | 0.1561 | Yes | ||
| 2 | MUS81 | 6660184 | 461 | 2.781 | 0.2183 | Yes | ||
| 3 | EGR1 | 4610347 | 861 | 2.187 | 0.2640 | Yes | ||
| 4 | CNN2 | 2230433 5270446 | 1121 | 1.897 | 0.3083 | Yes | ||
| 5 | JUNB | 4230048 | 1138 | 1.886 | 0.3653 | Yes | ||
| 6 | FLNA | 5390193 | 1171 | 1.860 | 0.4207 | Yes | ||
| 7 | TPM1 | 130673 | 1327 | 1.716 | 0.4651 | Yes | ||
| 8 | TAZ | 7100193 | 1342 | 1.703 | 0.5166 | Yes | ||
| 9 | ASB2 | 4760168 | 1405 | 1.640 | 0.5636 | Yes | ||
| 10 | MYL6 | 60563 6100152 | 1448 | 1.608 | 0.6107 | Yes | ||
| 11 | CAP1 | 2650278 | 3127 | 0.600 | 0.5388 | No | ||
| 12 | EGR3 | 6940128 | 3176 | 0.582 | 0.5541 | No | ||
| 13 | ACTG2 | 4780180 | 3456 | 0.485 | 0.5540 | No | ||
| 14 | PLCB3 | 4670402 | 3504 | 0.469 | 0.5658 | No | ||
| 15 | MRVI1 | 4810338 4850601 5900441 | 3747 | 0.405 | 0.5652 | No | ||
| 16 | TNNC1 | 1990575 | 4519 | 0.265 | 0.5319 | No | ||
| 17 | FOS | 1850315 | 4728 | 0.238 | 0.5280 | No | ||
| 18 | IER2 | 2030008 | 6120 | 0.117 | 0.4567 | No | ||
| 19 | CA3 | 870687 5890390 | 6154 | 0.116 | 0.4585 | No | ||
| 20 | THBS1 | 4560494 430288 | 6484 | 0.098 | 0.4438 | No | ||
| 21 | CFL1 | 2340735 | 6499 | 0.097 | 0.4460 | No | ||
| 22 | CALD1 | 1770129 1940397 | 7033 | 0.077 | 0.4197 | No | ||
| 23 | PHOX2B | 5270075 | 7421 | 0.064 | 0.4008 | No | ||
| 24 | TGFB1I1 | 2060288 6550450 | 7443 | 0.063 | 0.4016 | No | ||
| 25 | KCNMB1 | 4760139 | 8160 | 0.047 | 0.3645 | No | ||
| 26 | DIXDC1 | 6980435 | 8235 | 0.045 | 0.3619 | No | ||
| 27 | FOSL1 | 430021 | 8299 | 0.043 | 0.3598 | No | ||
| 28 | FOSB | 1940142 | 12252 | -0.030 | 0.1480 | No | ||
| 29 | MYH11 | 7100273 | 12254 | -0.030 | 0.1488 | No | ||
| 30 | ACTR3 | 1400497 | 13022 | -0.052 | 0.1091 | No | ||
| 31 | IL17B | 6940711 | 13088 | -0.054 | 0.1073 | No | ||
| 32 | GPR20 | 6620601 | 13437 | -0.067 | 0.0906 | No | ||
| 33 | ITGB1BP2 | 6200129 | 13607 | -0.076 | 0.0839 | No | ||
| 34 | TNMD | 3060520 | 13645 | -0.078 | 0.0843 | No | ||
| 35 | PFN1 | 6130132 | 14735 | -0.201 | 0.0318 | No | ||
| 36 | EGR4 | 3120750 | 14913 | -0.239 | 0.0296 | No | ||
| 37 | WDR1 | 1090129 3990121 | 15189 | -0.318 | 0.0246 | No | ||
| 38 | SCOC | 610048 2230053 | 15517 | -0.427 | 0.0201 | No | ||
| 39 | EGR2 | 3800403 | 15588 | -0.452 | 0.0302 | No | ||
| 40 | SLC25A4 | 2360519 | 16645 | -0.981 | 0.0035 | No | ||
| 41 | HOXB4 | 540131 | 17071 | -1.296 | 0.0203 | No | ||
| 42 | VCL | 4120487 | 17715 | -2.044 | 0.0485 | No |