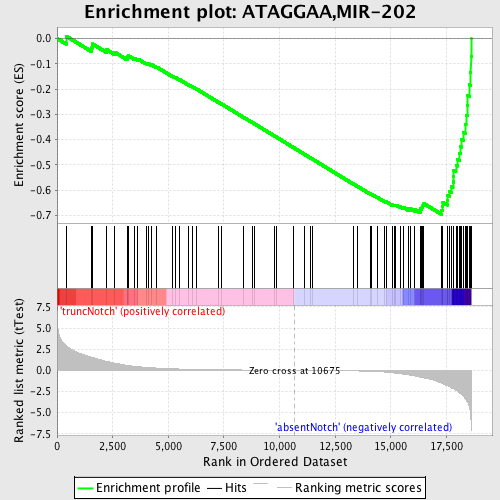
Profile of the Running ES Score & Positions of GeneSet Members on the Rank Ordered List
| Dataset | Set_03_absentNotch_versus_truncNotch.phenotype_absentNotch_versus_truncNotch.cls #truncNotch_versus_absentNotch |
| Phenotype | phenotype_absentNotch_versus_truncNotch.cls#truncNotch_versus_absentNotch |
| Upregulated in class | absentNotch |
| GeneSet | ATAGGAA,MIR-202 |
| Enrichment Score (ES) | -0.69593966 |
| Normalized Enrichment Score (NES) | -1.8835318 |
| Nominal p-value | 0.0 |
| FDR q-value | 0.002229769 |
| FWER p-Value | 0.0050 |
| PROBE | DESCRIPTION (from dataset) | GENE SYMBOL | GENE_TITLE | RANK IN GENE LIST | RANK METRIC SCORE | RUNNING ES | CORE ENRICHMENT | |
|---|---|---|---|---|---|---|---|---|
| 1 | NDRG1 | 1340040 | 410 | 2.903 | 0.0093 | No | ||
| 2 | TGFBR2 | 1780711 1980537 6550398 | 1564 | 1.525 | -0.0364 | No | ||
| 3 | PPARBP | 4280131 5690022 5860050 | 1593 | 1.509 | -0.0215 | No | ||
| 4 | TARDBP | 870390 2350093 | 2211 | 1.070 | -0.0432 | No | ||
| 5 | EI24 | 3120433 | 2576 | 0.866 | -0.0535 | No | ||
| 6 | EAF1 | 5420039 6550619 | 3149 | 0.592 | -0.0779 | No | ||
| 7 | VANGL2 | 70097 870075 | 3173 | 0.584 | -0.0729 | No | ||
| 8 | GRIA3 | 2900164 6130278 6860154 | 3204 | 0.573 | -0.0683 | No | ||
| 9 | BCL2 | 730132 1570736 2470138 3800044 4810037 5690068 5860504 6650164 | 3481 | 0.474 | -0.0780 | No | ||
| 10 | SSBP2 | 2260725 2900400 4730711 | 3630 | 0.435 | -0.0813 | No | ||
| 11 | BCL11A | 6860369 | 3999 | 0.352 | -0.0973 | No | ||
| 12 | NARG1 | 5910563 6350095 | 4098 | 0.334 | -0.0990 | No | ||
| 13 | HOXB2 | 6450592 | 4220 | 0.314 | -0.1021 | No | ||
| 14 | ARSB | 3190093 5360491 | 4481 | 0.272 | -0.1132 | No | ||
| 15 | HIP2 | 2810095 3990369 4120301 | 5188 | 0.184 | -0.1493 | No | ||
| 16 | RKHD3 | 6180471 | 5319 | 0.173 | -0.1544 | No | ||
| 17 | ENAH | 1690292 5700300 | 5512 | 0.158 | -0.1631 | No | ||
| 18 | DDEF1 | 1170411 4070465 | 5918 | 0.129 | -0.1835 | No | ||
| 19 | PCGF2 | 6370347 | 6086 | 0.119 | -0.1912 | No | ||
| 20 | ATXN1 | 5550156 | 6268 | 0.109 | -0.1998 | No | ||
| 21 | USP8 | 2640347 3840451 6100672 | 7235 | 0.070 | -0.2512 | No | ||
| 22 | CPEB3 | 3940164 | 7366 | 0.066 | -0.2575 | No | ||
| 23 | KHDRBS2 | 3520717 | 8364 | 0.042 | -0.3108 | No | ||
| 24 | ROBO2 | 450136 | 8774 | 0.033 | -0.3325 | No | ||
| 25 | HLF | 2370113 | 8873 | 0.031 | -0.3374 | No | ||
| 26 | RNF121 | 110079 1580279 | 9769 | 0.015 | -0.3855 | No | ||
| 27 | FAM60A | 3940092 | 9860 | 0.014 | -0.3902 | No | ||
| 28 | NR2F2 | 3170609 3310577 | 10615 | 0.001 | -0.4309 | No | ||
| 29 | KIAA1715 | 1190551 | 11115 | -0.008 | -0.4577 | No | ||
| 30 | USP15 | 610592 3520504 | 11380 | -0.012 | -0.4718 | No | ||
| 31 | KLF12 | 1660095 4810288 5340546 6520286 | 11457 | -0.014 | -0.4758 | No | ||
| 32 | ESR1 | 4060372 5860193 | 13327 | -0.063 | -0.5759 | No | ||
| 33 | ACSL3 | 3140195 | 13515 | -0.072 | -0.5852 | No | ||
| 34 | DNAJC10 | 2350601 | 14080 | -0.110 | -0.6144 | No | ||
| 35 | ACVR1 | 6840671 | 14141 | -0.115 | -0.6164 | No | ||
| 36 | SNAP91 | 3170056 5690520 | 14381 | -0.142 | -0.6278 | No | ||
| 37 | ERBB2IP | 580253 1090672 | 14707 | -0.196 | -0.6432 | No | ||
| 38 | LUZP1 | 940075 4280458 6180070 | 14789 | -0.213 | -0.6452 | No | ||
| 39 | SPRED1 | 6940706 | 15086 | -0.286 | -0.6581 | No | ||
| 40 | SNX16 | 870446 | 15159 | -0.310 | -0.6586 | No | ||
| 41 | BICD2 | 1090411 | 15223 | -0.330 | -0.6585 | No | ||
| 42 | PPP5C | 3130047 | 15422 | -0.394 | -0.6649 | No | ||
| 43 | CTBP2 | 430309 3710079 | 15569 | -0.445 | -0.6679 | No | ||
| 44 | THRAP2 | 4920600 | 15773 | -0.524 | -0.6732 | No | ||
| 45 | SORCS1 | 60411 5890373 | 15882 | -0.570 | -0.6729 | No | ||
| 46 | TRIM33 | 580619 2230280 3990433 6200747 | 16084 | -0.659 | -0.6766 | No | ||
| 47 | ZFAND3 | 2760504 | 16316 | -0.794 | -0.6805 | Yes | ||
| 48 | STAT3 | 460040 3710341 | 16330 | -0.801 | -0.6725 | Yes | ||
| 49 | PTEN | 3390064 | 16399 | -0.838 | -0.6671 | Yes | ||
| 50 | RAB22A | 110500 3830707 | 16443 | -0.865 | -0.6600 | Yes | ||
| 51 | RPS6KA3 | 1980707 | 16486 | -0.889 | -0.6527 | Yes | ||
| 52 | MIB1 | 3800537 | 17289 | -1.521 | -0.6795 | Yes | ||
| 53 | IQGAP1 | 6660494 | 17330 | -1.572 | -0.6646 | Yes | ||
| 54 | TCF12 | 3610324 7000156 | 17340 | -1.578 | -0.6480 | Yes | ||
| 55 | CBL | 6380068 | 17537 | -1.799 | -0.6391 | Yes | ||
| 56 | ELF1 | 4780450 | 17546 | -1.813 | -0.6199 | Yes | ||
| 57 | RAD52 | 110093 | 17646 | -1.925 | -0.6044 | Yes | ||
| 58 | YAF2 | 940053 | 17726 | -2.061 | -0.5864 | Yes | ||
| 59 | CD28 | 1400739 4210093 | 17795 | -2.145 | -0.5669 | Yes | ||
| 60 | RASA1 | 1240315 | 17822 | -2.176 | -0.5447 | Yes | ||
| 61 | BTG1 | 4200735 6040131 6200133 | 17833 | -2.195 | -0.5215 | Yes | ||
| 62 | CNN3 | 6110020 | 17930 | -2.342 | -0.5013 | Yes | ||
| 63 | TTC13 | 3520750 | 17989 | -2.440 | -0.4780 | Yes | ||
| 64 | CREBBP | 5690035 7040050 | 18081 | -2.625 | -0.4545 | Yes | ||
| 65 | DDX3X | 2190020 | 18122 | -2.725 | -0.4272 | Yes | ||
| 66 | MARCKS | 7040450 | 18164 | -2.808 | -0.3990 | Yes | ||
| 67 | BAG4 | 2260070 | 18272 | -3.077 | -0.3715 | Yes | ||
| 68 | SENP1 | 6100537 | 18355 | -3.381 | -0.3393 | Yes | ||
| 69 | SFPQ | 4760110 | 18381 | -3.477 | -0.3030 | Yes | ||
| 70 | RNF11 | 3990068 5080458 | 18437 | -3.723 | -0.2657 | Yes | ||
| 71 | KRAS | 2060170 | 18457 | -3.794 | -0.2257 | Yes | ||
| 72 | ANP32E | 6510706 | 18535 | -4.345 | -0.1828 | Yes | ||
| 73 | MAPK6 | 6760520 | 18578 | -4.847 | -0.1326 | Yes | ||
| 74 | APPBP2 | 5130215 | 18603 | -5.776 | -0.0714 | Yes | ||
| 75 | LBR | 4540671 | 18614 | -6.656 | 0.0001 | Yes |

