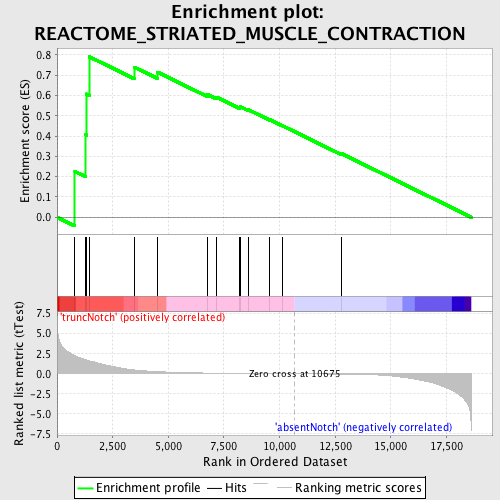
Profile of the Running ES Score & Positions of GeneSet Members on the Rank Ordered List
| Dataset | Set_03_absentNotch_versus_truncNotch.phenotype_absentNotch_versus_truncNotch.cls #truncNotch_versus_absentNotch |
| Phenotype | phenotype_absentNotch_versus_truncNotch.cls#truncNotch_versus_absentNotch |
| Upregulated in class | truncNotch |
| GeneSet | REACTOME_STRIATED_MUSCLE_CONTRACTION |
| Enrichment Score (ES) | 0.79049164 |
| Normalized Enrichment Score (NES) | 1.5192218 |
| Nominal p-value | 0.016032064 |
| FDR q-value | 0.38948792 |
| FWER p-Value | 0.999 |
| PROBE | DESCRIPTION (from dataset) | GENE SYMBOL | GENE_TITLE | RANK IN GENE LIST | RANK METRIC SCORE | RUNNING ES | CORE ENRICHMENT | |
|---|---|---|---|---|---|---|---|---|
| 1 | TCAP | 4890446 | 800 | 2.264 | 0.2255 | Yes | ||
| 2 | ACTN2 | 4200435 | 1292 | 1.743 | 0.4058 | Yes | ||
| 3 | TPM1 | 130673 | 1327 | 1.716 | 0.6075 | Yes | ||
| 4 | TNNI3 | 7000093 | 1456 | 1.601 | 0.7905 | Yes | ||
| 5 | VIM | 20431 | 3465 | 0.483 | 0.7398 | No | ||
| 6 | TNNC1 | 1990575 | 4519 | 0.265 | 0.7147 | No | ||
| 7 | TMOD1 | 3850100 | 6756 | 0.087 | 0.6048 | No | ||
| 8 | TNNT2 | 2450364 | 7148 | 0.073 | 0.5924 | No | ||
| 9 | DES | 1450341 | 8214 | 0.045 | 0.5405 | No | ||
| 10 | DMD | 1740041 3990332 | 8227 | 0.045 | 0.5452 | No | ||
| 11 | MYBPC2 | 1980368 | 8603 | 0.037 | 0.5295 | No | ||
| 12 | MYH6 | 2900373 | 9558 | 0.019 | 0.4804 | No | ||
| 13 | NEB | 580735 | 10110 | 0.009 | 0.4519 | No | ||
| 14 | MYL3 | 6040563 | 12802 | -0.045 | 0.3125 | No |

