Profile of the Running ES Score & Positions of GeneSet Members on the Rank Ordered List
| Dataset | Set_03_absentNotch_versus_truncNotch.phenotype_absentNotch_versus_truncNotch.cls #truncNotch_versus_absentNotch |
| Phenotype | phenotype_absentNotch_versus_truncNotch.cls#truncNotch_versus_absentNotch |
| Upregulated in class | truncNotch |
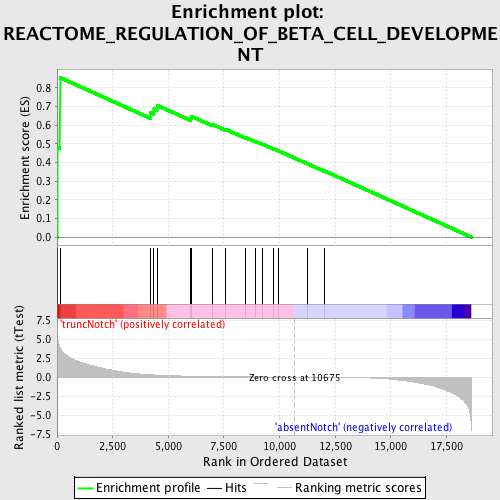
| GeneSet | REACTOME_REGULATION_OF_BETA_CELL_DEVELOPMENT |
| Enrichment Score (ES) | 0.85505575 |
| Normalized Enrichment Score (NES) | 1.7158184 |
| Nominal p-value | 0.0018281536 |
| FDR q-value | 0.05043351 |
| FWER p-Value | 0.162 |
| PROBE | DESCRIPTION (from dataset) | GENE SYMBOL | GENE_TITLE | RANK IN GENE LIST | RANK METRIC SCORE | RUNNING ES | CORE ENRICHMENT | |
|---|---|---|---|---|---|---|---|---|
| 1 | NOTCH1 | 3390114 | 35 | 4.954 | 0.4812 | Yes | ||
| 2 | HES1 | 4810280 | 129 | 3.885 | 0.8551 | Yes | ||
| 3 | NEUROD1 | 3060619 | 4212 | 0.316 | 0.6664 | No | ||
| 4 | IAPP | 4230040 | 4354 | 0.292 | 0.6873 | No | ||
| 5 | SLC2A2 | 5130537 5720722 6770079 | 4490 | 0.270 | 0.7064 | No | ||
| 6 | FOXA3 | 2680121 | 6016 | 0.123 | 0.6364 | No | ||
| 7 | PTF1A | 6450377 | 6057 | 0.121 | 0.6460 | No | ||
| 8 | FGF10 | 730458 840706 | 6977 | 0.079 | 0.6043 | No | ||
| 9 | NKX6-1 | 6040731 | 7578 | 0.060 | 0.5779 | No | ||
| 10 | PDX1 | 6660647 | 8481 | 0.040 | 0.5332 | No | ||
| 11 | INSM1 | 3450671 | 8918 | 0.030 | 0.5128 | No | ||
| 12 | NKX2-2 | 4150731 | 9251 | 0.024 | 0.4973 | No | ||
| 13 | ONECUT3 | 5720487 6100037 | 9734 | 0.015 | 0.4729 | No | ||
| 14 | PAX4 | 6620619 | 9949 | 0.012 | 0.4625 | No | ||
| 15 | AKT1 | 5290746 | 11234 | -0.010 | 0.3944 | No | ||
| 16 | HNF4G | 5720451 | 12001 | -0.025 | 0.3556 | No |

