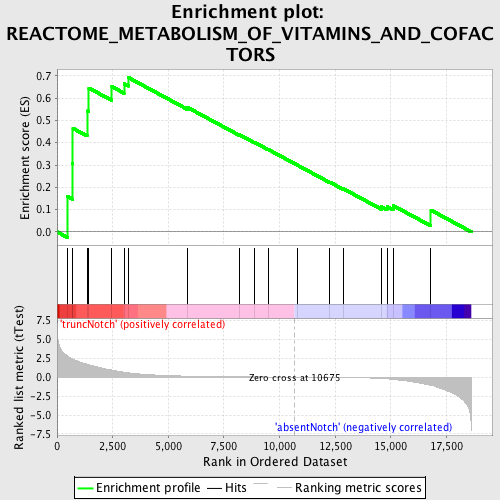
Profile of the Running ES Score & Positions of GeneSet Members on the Rank Ordered List
| Dataset | Set_03_absentNotch_versus_truncNotch.phenotype_absentNotch_versus_truncNotch.cls #truncNotch_versus_absentNotch |
| Phenotype | phenotype_absentNotch_versus_truncNotch.cls#truncNotch_versus_absentNotch |
| Upregulated in class | truncNotch |
| GeneSet | REACTOME_METABOLISM_OF_VITAMINS_AND_COFACTORS |
| Enrichment Score (ES) | 0.6920409 |
| Normalized Enrichment Score (NES) | 1.4250729 |
| Nominal p-value | 0.0670194 |
| FDR q-value | 0.5291636 |
| FWER p-Value | 1.0 |
| PROBE | DESCRIPTION (from dataset) | GENE SYMBOL | GENE_TITLE | RANK IN GENE LIST | RANK METRIC SCORE | RUNNING ES | CORE ENRICHMENT | |
|---|---|---|---|---|---|---|---|---|
| 1 | COASY | 6220707 | 464 | 2.776 | 0.1585 | Yes | ||
| 2 | SLC2A3 | 1990377 | 686 | 2.432 | 0.3074 | Yes | ||
| 3 | ACP5 | 2230717 | 713 | 2.396 | 0.4643 | Yes | ||
| 4 | CYB5R3 | 430097 6860400 | 1348 | 1.695 | 0.5423 | Yes | ||
| 5 | SHMT1 | 5900132 | 1430 | 1.620 | 0.6450 | Yes | ||
| 6 | SLC19A1 | 6770139 | 2463 | 0.935 | 0.6513 | Yes | ||
| 7 | ENPP1 | 780609 | 3009 | 0.646 | 0.6647 | Yes | ||
| 8 | QPRT | 670270 | 3205 | 0.572 | 0.6920 | Yes | ||
| 9 | DHFR | 6350315 | 5846 | 0.135 | 0.5590 | No | ||
| 10 | HAAO | 430369 450113 | 8195 | 0.046 | 0.4358 | No | ||
| 11 | TDO2 | 6110048 | 8867 | 0.031 | 0.4018 | No | ||
| 12 | MTHFD1 | 5900398 6520427 | 9499 | 0.020 | 0.3692 | No | ||
| 13 | SLC25A16 | 4200341 | 10782 | -0.002 | 0.3003 | No | ||
| 14 | KYNU | 1410435 | 12249 | -0.030 | 0.2235 | No | ||
| 15 | MTHFR | 7100253 | 12852 | -0.046 | 0.1942 | No | ||
| 16 | KMO | 7000132 | 14568 | -0.169 | 0.1131 | No | ||
| 17 | FASN | 430717 | 14830 | -0.219 | 0.1136 | No | ||
| 18 | AFMID | 1500398 1770093 1990315 3440056 3520500 6400075 | 15101 | -0.291 | 0.1183 | No | ||
| 19 | CYB5A | 5080450 | 16804 | -1.069 | 0.0974 | No |

