Profile of the Running ES Score & Positions of GeneSet Members on the Rank Ordered List
| Dataset | Set_03_absentNotch_versus_truncNotch.phenotype_absentNotch_versus_truncNotch.cls #truncNotch_versus_absentNotch |
| Phenotype | phenotype_absentNotch_versus_truncNotch.cls#truncNotch_versus_absentNotch |
| Upregulated in class | absentNotch |
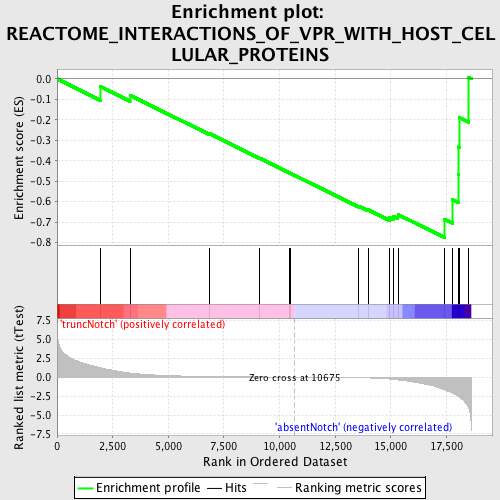
| GeneSet | REACTOME_INTERACTIONS_OF_VPR_WITH_HOST_CELLULAR_PROTEINS |
| Enrichment Score (ES) | -0.7746334 |
| Normalized Enrichment Score (NES) | -1.5973847 |
| Nominal p-value | 0.011185682 |
| FDR q-value | 0.24242239 |
| FWER p-Value | 0.929 |
| PROBE | DESCRIPTION (from dataset) | GENE SYMBOL | GENE_TITLE | RANK IN GENE LIST | RANK METRIC SCORE | RUNNING ES | CORE ENRICHMENT | |
|---|---|---|---|---|---|---|---|---|
| 1 | BANF1 | 460164 2850170 6110139 | 1959 | 1.233 | -0.0387 | No | ||
| 2 | NUP62 | 1240128 | 3277 | 0.545 | -0.0800 | No | ||
| 3 | NUP35 | 5340408 | 6827 | 0.084 | -0.2663 | No | ||
| 4 | NUP188 | 1190470 | 9111 | 0.027 | -0.3876 | No | ||
| 5 | NUP153 | 7000452 | 10430 | 0.004 | -0.4582 | No | ||
| 6 | TPR | 1990066 6550390 | 10504 | 0.003 | -0.4620 | No | ||
| 7 | NUP54 | 940546 2360156 4060278 | 13556 | -0.073 | -0.6221 | No | ||
| 8 | NUPL2 | 6550537 | 13975 | -0.101 | -0.6391 | No | ||
| 9 | RANBP2 | 4280338 | 14930 | -0.242 | -0.6773 | No | ||
| 10 | NUP37 | 2370097 6370435 6380008 | 15129 | -0.298 | -0.6718 | No | ||
| 11 | RAE1 | 7050121 | 15322 | -0.357 | -0.6629 | No | ||
| 12 | NUP43 | 3360482 | 17402 | -1.656 | -0.6852 | Yes | ||
| 13 | KPNA1 | 5270324 | 17777 | -2.121 | -0.5907 | Yes | ||
| 14 | NUP155 | 5720576 6220114 | 18034 | -2.514 | -0.4686 | Yes | ||
| 15 | NUP160 | 1990551 | 18043 | -2.526 | -0.3325 | Yes | ||
| 16 | NUP93 | 2190273 | 18099 | -2.684 | -0.1904 | Yes | ||
| 17 | NUP107 | 6380021 | 18496 | -4.037 | 0.0065 | Yes |

