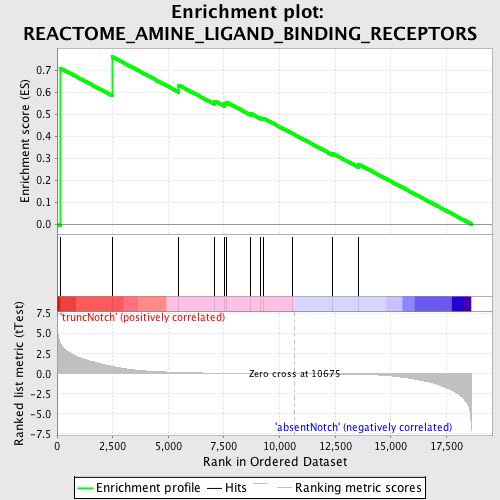
Profile of the Running ES Score & Positions of GeneSet Members on the Rank Ordered List
| Dataset | Set_03_absentNotch_versus_truncNotch.phenotype_absentNotch_versus_truncNotch.cls #truncNotch_versus_absentNotch |
| Phenotype | phenotype_absentNotch_versus_truncNotch.cls#truncNotch_versus_absentNotch |
| Upregulated in class | truncNotch |
| GeneSet | REACTOME_AMINE_LIGAND_BINDING_RECEPTORS |
| Enrichment Score (ES) | 0.7605799 |
| Normalized Enrichment Score (NES) | 1.4115528 |
| Nominal p-value | 0.04681648 |
| FDR q-value | 0.5691252 |
| FWER p-Value | 1.0 |
| PROBE | DESCRIPTION (from dataset) | GENE SYMBOL | GENE_TITLE | RANK IN GENE LIST | RANK METRIC SCORE | RUNNING ES | CORE ENRICHMENT | |
|---|---|---|---|---|---|---|---|---|
| 1 | ADRB2 | 3290373 | 156 | 3.712 | 0.7086 | Yes | ||
| 2 | HRH2 | 3840440 | 2485 | 0.917 | 0.7606 | Yes | ||
| 3 | HTR2A | 360037 6330255 | 5466 | 0.162 | 0.6317 | No | ||
| 4 | CHRM5 | 5390333 | 7081 | 0.075 | 0.5595 | No | ||
| 5 | HRH1 | 840100 | 7537 | 0.061 | 0.5467 | No | ||
| 6 | HTR1F | 670148 | 7623 | 0.059 | 0.5535 | No | ||
| 7 | DRD3 | 4780402 | 8710 | 0.035 | 0.5018 | No | ||
| 8 | CHRM2 | 870750 | 9159 | 0.026 | 0.4827 | No | ||
| 9 | ADRA2A | 5340520 | 9275 | 0.024 | 0.4811 | No | ||
| 10 | HTR6 | 4850022 | 10564 | 0.002 | 0.4121 | No | ||
| 11 | ADRA1D | 380035 540025 | 12390 | -0.033 | 0.3205 | No | ||
| 12 | DRD1 | 430025 | 13545 | -0.073 | 0.2726 | No |

