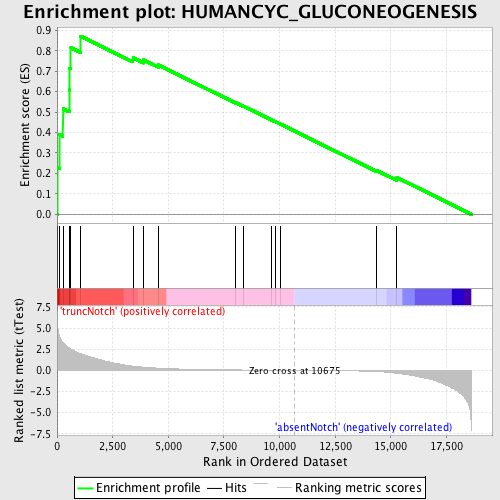
Profile of the Running ES Score & Positions of GeneSet Members on the Rank Ordered List
| Dataset | Set_03_absentNotch_versus_truncNotch.phenotype_absentNotch_versus_truncNotch.cls #truncNotch_versus_absentNotch |
| Phenotype | phenotype_absentNotch_versus_truncNotch.cls#truncNotch_versus_absentNotch |
| Upregulated in class | truncNotch |
| GeneSet | HUMANCYC_GLUCONEOGENESIS |
| Enrichment Score (ES) | 0.8718244 |
| Normalized Enrichment Score (NES) | 1.7603606 |
| Nominal p-value | 0.0 |
| FDR q-value | 0.045321904 |
| FWER p-Value | 0.078 |
| PROBE | DESCRIPTION (from dataset) | GENE SYMBOL | GENE_TITLE | RANK IN GENE LIST | RANK METRIC SCORE | RUNNING ES | CORE ENRICHMENT | |
|---|---|---|---|---|---|---|---|---|
| 1 | ALDOA | 6290672 | 20 | 5.593 | 0.2274 | Yes | ||
| 2 | FBP1 | 1470762 | 104 | 4.079 | 0.3896 | Yes | ||
| 3 | ENO3 | 5270136 | 264 | 3.305 | 0.5160 | Yes | ||
| 4 | PGAM2 | 3610605 | 551 | 2.637 | 0.6084 | Yes | ||
| 5 | PGAM1 | 2570133 | 568 | 2.619 | 0.7145 | Yes | ||
| 6 | ENO1 | 5340128 | 621 | 2.530 | 0.8150 | Yes | ||
| 7 | PGK1 | 1570494 630300 | 1055 | 1.960 | 0.8718 | Yes | ||
| 8 | MDH2 | 1850601 | 3411 | 0.501 | 0.7657 | No | ||
| 9 | GAPDHS | 2690463 | 3886 | 0.376 | 0.7555 | No | ||
| 10 | FBP2 | 1580193 | 4546 | 0.261 | 0.7308 | No | ||
| 11 | ALDOC | 450121 610427 | 8021 | 0.050 | 0.5460 | No | ||
| 12 | PGK2 | 2650091 | 8391 | 0.041 | 0.5279 | No | ||
| 13 | BPGM | 5080520 | 9655 | 0.017 | 0.4607 | No | ||
| 14 | ENO2 | 2320068 | 9796 | 0.015 | 0.4538 | No | ||
| 15 | ALDOB | 4730324 | 10059 | 0.010 | 0.4401 | No | ||
| 16 | MDH1 | 6660358 6760731 | 14373 | -0.141 | 0.2140 | No | ||
| 17 | ME2 | 5080121 | 15273 | -0.345 | 0.1797 | No |

