Profile of the Running ES Score & Positions of GeneSet Members on the Rank Ordered List
| Dataset | Set_03_absentNotch_versus_wtNotch.phenotype_absentNotch_versus_wtNotch.cls #absentNotch_versus_wtNotch.phenotype_absentNotch_versus_wtNotch.cls #absentNotch_versus_wtNotch_repos |
| Phenotype | phenotype_absentNotch_versus_wtNotch.cls#absentNotch_versus_wtNotch_repos |
| Upregulated in class | absentNotch |
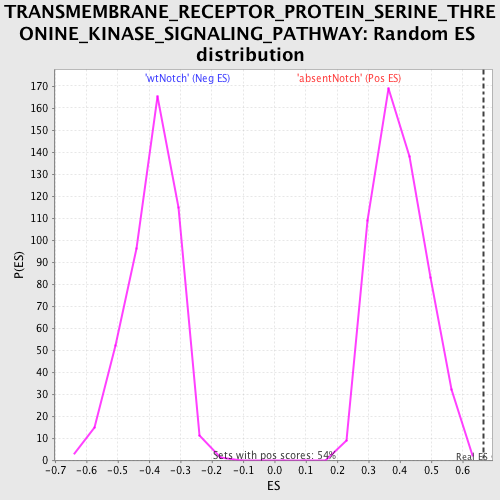
| GeneSet | TRANSMEMBRANE_RECEPTOR_PROTEIN_SERINE_THREONINE_KINASE_SIGNALING_PATHWAY |
| Enrichment Score (ES) | 0.6671114 |
| Normalized Enrichment Score (NES) | 1.6767488 |
| Nominal p-value | 0.0 |
| FDR q-value | 0.5337759 |
| FWER p-Value | 0.643 |
| PROBE | DESCRIPTION (from dataset) | GENE SYMBOL | GENE_TITLE | RANK IN GENE LIST | RANK METRIC SCORE | RUNNING ES | CORE ENRICHMENT | |
|---|---|---|---|---|---|---|---|---|
| 1 | ACVR2B | 1660546 | 245 | 1.806 | 0.1292 | Yes | ||
| 2 | LEFTY1 | 3290452 | 912 | 1.075 | 0.1781 | Yes | ||
| 3 | SMAD4 | 5670519 | 943 | 1.053 | 0.2595 | Yes | ||
| 4 | CDKN1C | 6520577 | 1066 | 0.999 | 0.3317 | Yes | ||
| 5 | STUB1 | 5860086 | 1100 | 0.985 | 0.4075 | Yes | ||
| 6 | SMAD5 | 5700497 | 1463 | 0.792 | 0.4505 | Yes | ||
| 7 | SMAD3 | 6450671 | 1491 | 0.778 | 0.5104 | Yes | ||
| 8 | EID2 | 3130176 | 1559 | 0.751 | 0.5660 | Yes | ||
| 9 | CITED2 | 5670114 5130088 | 2190 | 0.502 | 0.5717 | Yes | ||
| 10 | SMURF1 | 520609 580647 | 2448 | 0.424 | 0.5913 | Yes | ||
| 11 | HPGD | 6770192 | 2724 | 0.355 | 0.6044 | Yes | ||
| 12 | BMPR1A | 2190193 4060603 | 2815 | 0.335 | 0.6260 | Yes | ||
| 13 | ACVR1 | 6840671 | 2962 | 0.301 | 0.6419 | Yes | ||
| 14 | CDKN2B | 6020040 | 3040 | 0.285 | 0.6602 | Yes | ||
| 15 | ZFYVE9 | 6980288 7100017 | 3271 | 0.245 | 0.6671 | Yes | ||
| 16 | ACVR1B | 3610446 5570195 | 4380 | 0.128 | 0.6176 | No | ||
| 17 | MAP3K7 | 6040068 | 4873 | 0.099 | 0.5989 | No | ||
| 18 | SMAD2 | 4200592 | 4981 | 0.094 | 0.6005 | No | ||
| 19 | GDF15 | 4730017 | 5056 | 0.091 | 0.6037 | No | ||
| 20 | LTBP2 | 4850039 | 5221 | 0.084 | 0.6015 | No | ||
| 21 | HIPK2 | 6350647 | 6230 | 0.053 | 0.5514 | No | ||
| 22 | RGMB | 670504 4570450 | 6934 | 0.037 | 0.5165 | No | ||
| 23 | SMAD1 | 630537 1850333 | 7005 | 0.036 | 0.5156 | No | ||
| 24 | ACVRL1 | 3290600 | 7205 | 0.032 | 0.5074 | No | ||
| 25 | CIDEA | 4560020 | 7819 | 0.022 | 0.4762 | No | ||
| 26 | TGFB1 | 1940162 | 7861 | 0.021 | 0.4757 | No | ||
| 27 | SNX6 | 6200086 | 8226 | 0.016 | 0.4573 | No | ||
| 28 | LEFTY2 | 5670364 | 8270 | 0.015 | 0.4562 | No | ||
| 29 | GDF9 | 2350181 | 9099 | 0.004 | 0.4119 | No | ||
| 30 | TGFBR3 | 5290577 | 9725 | -0.005 | 0.3787 | No | ||
| 31 | ACVR2A | 6110647 | 10043 | -0.009 | 0.3623 | No | ||
| 32 | SMAD7 | 430377 | 11097 | -0.026 | 0.3077 | No | ||
| 33 | KLF10 | 4850056 | 11576 | -0.034 | 0.2846 | No | ||
| 34 | SOST | 1170195 | 11717 | -0.037 | 0.2801 | No | ||
| 35 | GDF5 | 510440 | 11841 | -0.039 | 0.2765 | No | ||
| 36 | FMOD | 540577 | 12126 | -0.046 | 0.2649 | No | ||
| 37 | ENG | 4280270 | 12177 | -0.047 | 0.2658 | No | ||
| 38 | GDF10 | 4850082 | 12601 | -0.057 | 0.2476 | No | ||
| 39 | IL17F | 670577 | 12766 | -0.062 | 0.2437 | No | ||
| 40 | FOXH1 | 2060180 | 12910 | -0.067 | 0.2412 | No | ||
| 41 | TGFBR1 | 1400148 4280020 6550711 | 14036 | -0.118 | 0.1900 | No | ||
| 42 | BMPR2 | 5340066 6960328 | 14338 | -0.138 | 0.1846 | No | ||
| 43 | FNTA | 70059 | 16764 | -0.579 | 0.0997 | No |