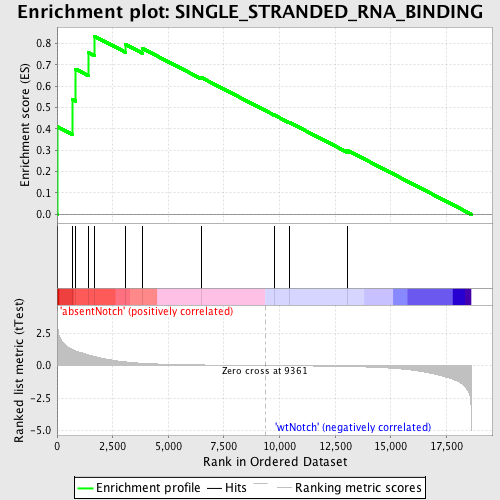
Profile of the Running ES Score & Positions of GeneSet Members on the Rank Ordered List
| Dataset | Set_03_absentNotch_versus_wtNotch.phenotype_absentNotch_versus_wtNotch.cls #absentNotch_versus_wtNotch.phenotype_absentNotch_versus_wtNotch.cls #absentNotch_versus_wtNotch_repos |
| Phenotype | phenotype_absentNotch_versus_wtNotch.cls#absentNotch_versus_wtNotch_repos |
| Upregulated in class | absentNotch |
| GeneSet | SINGLE_STRANDED_RNA_BINDING |
| Enrichment Score (ES) | 0.8339144 |
| Normalized Enrichment Score (NES) | 1.5561042 |
| Nominal p-value | 0.0056497175 |
| FDR q-value | 1.0 |
| FWER p-Value | 1.0 |
| PROBE | DESCRIPTION (from dataset) | GENE SYMBOL | GENE_TITLE | RANK IN GENE LIST | RANK METRIC SCORE | RUNNING ES | CORE ENRICHMENT | |
|---|---|---|---|---|---|---|---|---|
| 1 | HNRPDL | 1050102 1090181 5360471 | 17 | 3.143 | 0.4098 | Yes | ||
| 2 | ZFP36 | 2030605 | 675 | 1.248 | 0.5376 | Yes | ||
| 3 | PABPC1 | 2650180 2690253 6020632 1990270 | 819 | 1.149 | 0.6800 | Yes | ||
| 4 | EIF4A3 | 3440538 | 1395 | 0.827 | 0.7571 | Yes | ||
| 5 | HNRPH1 | 1170086 3140546 3290471 6110184 6110373 | 1665 | 0.698 | 0.8339 | Yes | ||
| 6 | ATXN1 | 5550156 | 3076 | 0.278 | 0.7945 | No | ||
| 7 | PABPC4 | 1990170 6760270 5390138 | 3844 | 0.171 | 0.7756 | No | ||
| 8 | TIA1 | 4670373 | 6486 | 0.047 | 0.6398 | No | ||
| 9 | ADARB2 | 2190170 | 9752 | -0.005 | 0.4649 | No | ||
| 10 | TLR8 | 1240092 | 10423 | -0.015 | 0.4309 | No | ||
| 11 | TLR7 | 3140300 | 13042 | -0.072 | 0.2996 | No |

