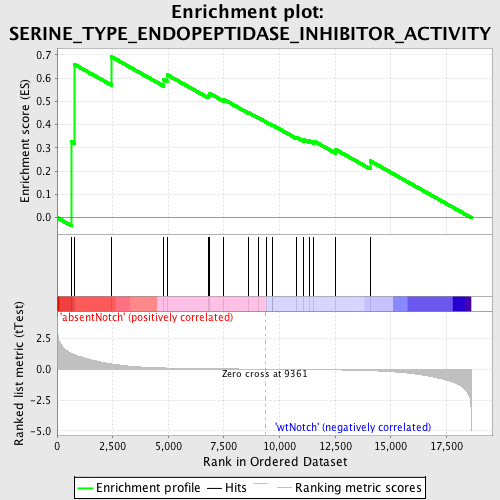
Profile of the Running ES Score & Positions of GeneSet Members on the Rank Ordered List
| Dataset | Set_03_absentNotch_versus_wtNotch.phenotype_absentNotch_versus_wtNotch.cls #absentNotch_versus_wtNotch.phenotype_absentNotch_versus_wtNotch.cls #absentNotch_versus_wtNotch_repos |
| Phenotype | phenotype_absentNotch_versus_wtNotch.cls#absentNotch_versus_wtNotch_repos |
| Upregulated in class | absentNotch |
| GeneSet | SERINE_TYPE_ENDOPEPTIDASE_INHIBITOR_ACTIVITY |
| Enrichment Score (ES) | 0.6919137 |
| Normalized Enrichment Score (NES) | 1.5020126 |
| Nominal p-value | 0.026515152 |
| FDR q-value | 0.74771595 |
| FWER p-Value | 1.0 |
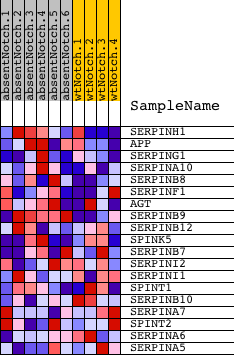
| PROBE | DESCRIPTION (from dataset) | GENE SYMBOL | GENE_TITLE | RANK IN GENE LIST | RANK METRIC SCORE | RUNNING ES | CORE ENRICHMENT | |
|---|---|---|---|---|---|---|---|---|
| 1 | SERPINH1 | 6130014 | 663 | 1.257 | 0.3260 | Yes | ||
| 2 | APP | 2510053 | 778 | 1.180 | 0.6595 | Yes | ||
| 3 | SERPING1 | 5550440 | 2446 | 0.424 | 0.6919 | Yes | ||
| 4 | SERPINA10 | 2360114 | 4800 | 0.102 | 0.5949 | No | ||
| 5 | SERPINB8 | 4050465 | 4945 | 0.096 | 0.6147 | No | ||
| 6 | SERPINF1 | 7040367 | 6790 | 0.040 | 0.5272 | No | ||
| 7 | AGT | 7000575 | 6867 | 0.039 | 0.5342 | No | ||
| 8 | SERPINB9 | 780148 | 7483 | 0.028 | 0.5091 | No | ||
| 9 | SERPINB12 | 1500671 | 8588 | 0.011 | 0.4529 | No | ||
| 10 | SPINK5 | 5900010 | 9037 | 0.004 | 0.4300 | No | ||
| 11 | SERPINB7 | 2630010 | 9408 | -0.001 | 0.4103 | No | ||
| 12 | SERPINI2 | 1570427 | 9675 | -0.004 | 0.3972 | No | ||
| 13 | SERPINI1 | 2940468 | 9697 | -0.004 | 0.3973 | No | ||
| 14 | SPINT1 | 3190059 | 10767 | -0.020 | 0.3456 | No | ||
| 15 | SERPINB10 | 130441 | 11095 | -0.026 | 0.3355 | No | ||
| 16 | SERPINA7 | 2510537 | 11329 | -0.029 | 0.3314 | No | ||
| 17 | SPINT2 | 2630039 6110519 | 11543 | -0.034 | 0.3297 | No | ||
| 18 | SERPINA6 | 1850707 | 12527 | -0.056 | 0.2929 | No | ||
| 19 | SERPINA5 | 3060400 | 14070 | -0.120 | 0.2444 | No |