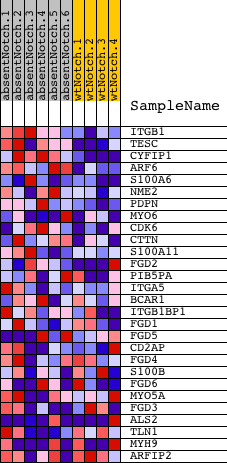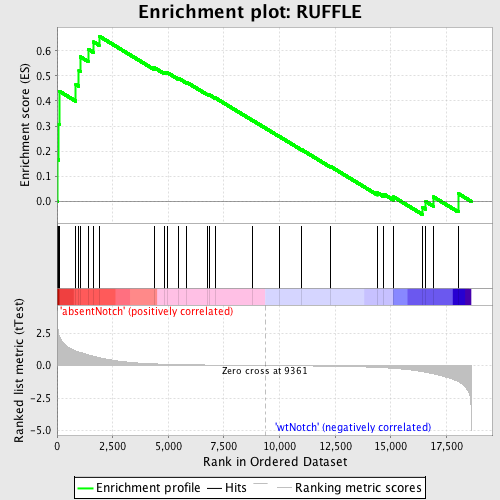
Profile of the Running ES Score & Positions of GeneSet Members on the Rank Ordered List
| Dataset | Set_03_absentNotch_versus_wtNotch.phenotype_absentNotch_versus_wtNotch.cls #absentNotch_versus_wtNotch.phenotype_absentNotch_versus_wtNotch.cls #absentNotch_versus_wtNotch_repos |
| Phenotype | phenotype_absentNotch_versus_wtNotch.cls#absentNotch_versus_wtNotch_repos |
| Upregulated in class | absentNotch |
| GeneSet | RUFFLE |
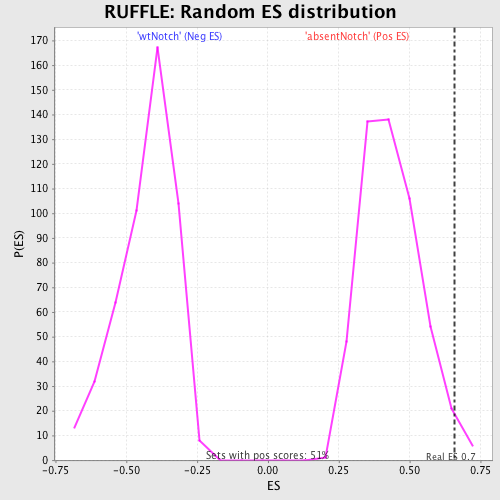
| Enrichment Score (ES) | 0.65830004 |
| Normalized Enrichment Score (NES) | 1.5092986 |
| Nominal p-value | 0.021526419 |
| FDR q-value | 0.8301315 |
| FWER p-Value | 1.0 |
| PROBE | DESCRIPTION (from dataset) | GENE SYMBOL | GENE_TITLE | RANK IN GENE LIST | RANK METRIC SCORE | RUNNING ES | CORE ENRICHMENT | |
|---|---|---|---|---|---|---|---|---|
| 1 | ITGB1 | 5080156 6270528 | 36 | 2.818 | 0.1658 | Yes | ||
| 2 | TESC | 6550273 | 74 | 2.385 | 0.3057 | Yes | ||
| 3 | CYFIP1 | 5690082 | 95 | 2.260 | 0.4392 | Yes | ||
| 4 | ARF6 | 3520026 | 843 | 1.123 | 0.4658 | Yes | ||
| 5 | S100A6 | 1690204 | 980 | 1.028 | 0.5197 | Yes | ||
| 6 | NME2 | 2190672 | 1042 | 1.002 | 0.5761 | Yes | ||
| 7 | PDPN | 4640280 | 1396 | 0.827 | 0.6063 | Yes | ||
| 8 | MYO6 | 2190332 | 1643 | 0.707 | 0.6351 | Yes | ||
| 9 | CDK6 | 4920253 | 1888 | 0.610 | 0.6583 | Yes | ||
| 10 | CTTN | 780154 1690538 3310017 4060717 | 4377 | 0.128 | 0.5321 | No | ||
| 11 | S100A11 | 2260064 | 4811 | 0.102 | 0.5148 | No | ||
| 12 | FGD2 | 5340195 | 4940 | 0.096 | 0.5137 | No | ||
| 13 | PIB5PA | 6900427 | 5453 | 0.076 | 0.4906 | No | ||
| 14 | ITGA5 | 5550520 | 5820 | 0.064 | 0.4748 | No | ||
| 15 | BCAR1 | 1340215 | 6757 | 0.041 | 0.4268 | No | ||
| 16 | ITGB1BP1 | 3830121 | 6848 | 0.039 | 0.4243 | No | ||
| 17 | FGD1 | 4780021 | 7103 | 0.034 | 0.4127 | No | ||
| 18 | FGD5 | 3520438 4060500 | 8794 | 0.008 | 0.3222 | No | ||
| 19 | CD2AP | 1940369 | 10002 | -0.009 | 0.2578 | No | ||
| 20 | FGD4 | 520168 870411 2640253 6550338 6650364 | 10998 | -0.024 | 0.2057 | No | ||
| 21 | S100B | 6520088 | 12285 | -0.049 | 0.1395 | No | ||
| 22 | FGD6 | 610632 | 14403 | -0.142 | 0.0341 | No | ||
| 23 | MYO5A | 2900288 5270333 | 14680 | -0.167 | 0.0292 | No | ||
| 24 | FGD3 | 5690465 | 15123 | -0.213 | 0.0181 | No | ||
| 25 | ALS2 | 3130546 6400070 | 16426 | -0.474 | -0.0238 | No | ||
| 26 | TLN1 | 6590411 | 16573 | -0.517 | -0.0009 | No | ||
| 27 | MYH9 | 3120091 4850292 | 16916 | -0.628 | 0.0181 | No | ||
| 28 | ARFIP2 | 1850301 4670180 | 18032 | -1.232 | 0.0314 | No |