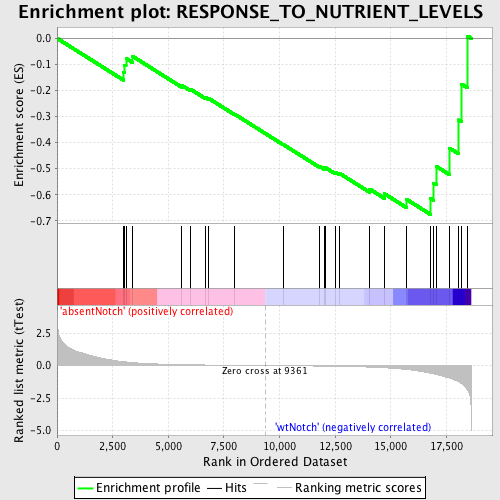
Profile of the Running ES Score & Positions of GeneSet Members on the Rank Ordered List
| Dataset | Set_03_absentNotch_versus_wtNotch.phenotype_absentNotch_versus_wtNotch.cls #absentNotch_versus_wtNotch.phenotype_absentNotch_versus_wtNotch.cls #absentNotch_versus_wtNotch_repos |
| Phenotype | phenotype_absentNotch_versus_wtNotch.cls#absentNotch_versus_wtNotch_repos |
| Upregulated in class | wtNotch |
| GeneSet | RESPONSE_TO_NUTRIENT_LEVELS |
| Enrichment Score (ES) | -0.67574346 |
| Normalized Enrichment Score (NES) | -1.5525166 |
| Nominal p-value | 0.012552301 |
| FDR q-value | 1.0 |
| FWER p-Value | 0.999 |
| PROBE | DESCRIPTION (from dataset) | GENE SYMBOL | GENE_TITLE | RANK IN GENE LIST | RANK METRIC SCORE | RUNNING ES | CORE ENRICHMENT | |
|---|---|---|---|---|---|---|---|---|
| 1 | GCGR | 6620497 | 2981 | 0.297 | -0.1293 | No | ||
| 2 | CDKN2B | 6020040 | 3040 | 0.285 | -0.1027 | No | ||
| 3 | PPARG | 1990168 2680603 6130632 | 3098 | 0.276 | -0.0768 | No | ||
| 4 | STC1 | 360161 | 3377 | 0.228 | -0.0679 | No | ||
| 5 | GHRL | 2360619 6760438 | 5601 | 0.071 | -0.1801 | No | ||
| 6 | FADS1 | 5270537 | 5983 | 0.059 | -0.1944 | No | ||
| 7 | GHSR | 1980465 7050521 | 6657 | 0.043 | -0.2262 | No | ||
| 8 | LEP | 4010053 | 6815 | 0.040 | -0.2304 | No | ||
| 9 | PCSK9 | 3120044 | 7970 | 0.020 | -0.2904 | No | ||
| 10 | CARTPT | 6660687 | 10161 | -0.011 | -0.4071 | No | ||
| 11 | ENSA | 6620546 | 11800 | -0.039 | -0.4911 | No | ||
| 12 | SST | 6590142 | 12001 | -0.043 | -0.4974 | No | ||
| 13 | ENPP1 | 780609 | 12072 | -0.044 | -0.4965 | No | ||
| 14 | CCKAR | 4210079 | 12516 | -0.055 | -0.5146 | No | ||
| 15 | SREBF1 | 4780333 | 12682 | -0.060 | -0.5172 | No | ||
| 16 | NPY | 3170138 | 14048 | -0.119 | -0.5782 | No | ||
| 17 | SSTR1 | 2630471 | 14715 | -0.170 | -0.5963 | No | ||
| 18 | STC2 | 4920601 | 15717 | -0.306 | -0.6182 | Yes | ||
| 19 | TULP4 | 2320364 | 16788 | -0.586 | -0.6145 | Yes | ||
| 20 | ASNS | 110368 7100687 | 16920 | -0.630 | -0.5557 | Yes | ||
| 21 | CHMP1A | 5550441 | 17041 | -0.682 | -0.4909 | Yes | ||
| 22 | CDKN2D | 6040035 | 17647 | -0.974 | -0.4216 | Yes | ||
| 23 | OGT | 2360131 4610333 | 18039 | -1.238 | -0.3132 | Yes | ||
| 24 | TP53 | 6130707 | 18184 | -1.390 | -0.1756 | Yes | ||
| 25 | SSTR2 | 4590687 | 18457 | -1.902 | 0.0086 | Yes |

