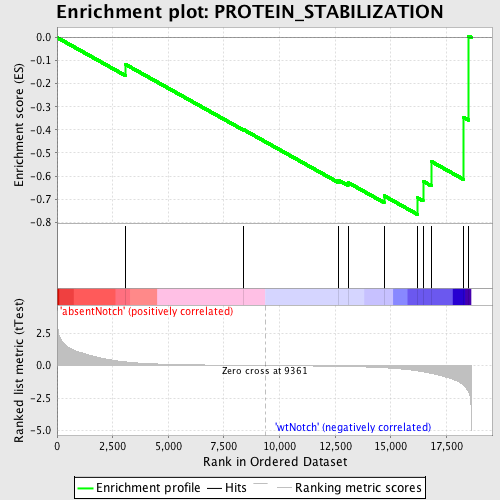
Profile of the Running ES Score & Positions of GeneSet Members on the Rank Ordered List
| Dataset | Set_03_absentNotch_versus_wtNotch.phenotype_absentNotch_versus_wtNotch.cls #absentNotch_versus_wtNotch.phenotype_absentNotch_versus_wtNotch.cls #absentNotch_versus_wtNotch_repos |
| Phenotype | phenotype_absentNotch_versus_wtNotch.cls#absentNotch_versus_wtNotch_repos |
| Upregulated in class | wtNotch |
| GeneSet | PROTEIN_STABILIZATION |
| Enrichment Score (ES) | -0.76658106 |
| Normalized Enrichment Score (NES) | -1.4271038 |
| Nominal p-value | 0.06187625 |
| FDR q-value | 1.0 |
| FWER p-Value | 1.0 |
| PROBE | DESCRIPTION (from dataset) | GENE SYMBOL | GENE_TITLE | RANK IN GENE LIST | RANK METRIC SCORE | RUNNING ES | CORE ENRICHMENT | |
|---|---|---|---|---|---|---|---|---|
| 1 | APOA1 | 110152 | 3085 | 0.278 | -0.1169 | No | ||
| 2 | PPARGC1A | 4670040 | 8383 | 0.014 | -0.3992 | No | ||
| 3 | HPS4 | 6940110 | 12645 | -0.059 | -0.6179 | No | ||
| 4 | STX12 | 610451 | 13077 | -0.073 | -0.6282 | No | ||
| 5 | MDM4 | 4070504 4780008 | 14699 | -0.168 | -0.6857 | No | ||
| 6 | COG7 | 360133 | 16205 | -0.410 | -0.6943 | Yes | ||
| 7 | GTPBP4 | 6840332 | 16450 | -0.482 | -0.6227 | Yes | ||
| 8 | COG3 | 3840746 | 16821 | -0.599 | -0.5370 | Yes | ||
| 9 | TBRG1 | 6110678 6520181 | 18279 | -1.531 | -0.3458 | Yes | ||
| 10 | PEX6 | 2100253 6660162 | 18503 | -2.067 | 0.0061 | Yes |

