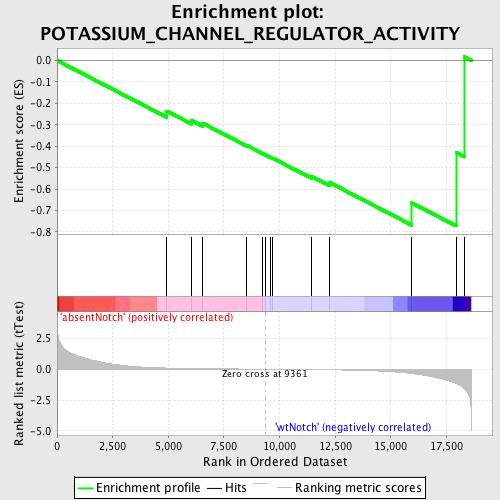
Profile of the Running ES Score & Positions of GeneSet Members on the Rank Ordered List
| Dataset | Set_03_absentNotch_versus_wtNotch.phenotype_absentNotch_versus_wtNotch.cls #absentNotch_versus_wtNotch.phenotype_absentNotch_versus_wtNotch.cls #absentNotch_versus_wtNotch_repos |
| Phenotype | phenotype_absentNotch_versus_wtNotch.cls#absentNotch_versus_wtNotch_repos |
| Upregulated in class | wtNotch |
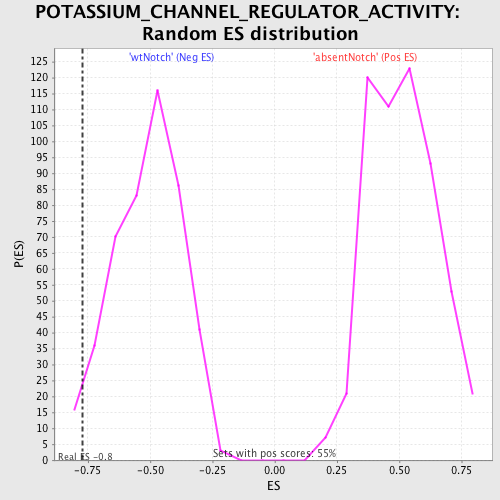
| GeneSet | POTASSIUM_CHANNEL_REGULATOR_ACTIVITY |
| Enrichment Score (ES) | -0.77235824 |
| Normalized Enrichment Score (NES) | -1.515793 |
| Nominal p-value | 0.031042129 |
| FDR q-value | 1.0 |
| FWER p-Value | 1.0 |
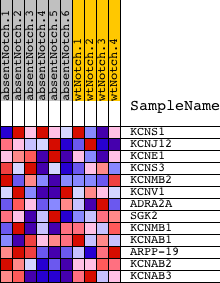
| PROBE | DESCRIPTION (from dataset) | GENE SYMBOL | GENE_TITLE | RANK IN GENE LIST | RANK METRIC SCORE | RUNNING ES | CORE ENRICHMENT | |
|---|---|---|---|---|---|---|---|---|
| 1 | KCNS1 | 2570195 | 4932 | 0.097 | -0.2365 | No | ||
| 2 | KCNJ12 | 3870364 | 6054 | 0.057 | -0.2800 | No | ||
| 3 | KCNE1 | 1230520 1690372 4120050 | 6545 | 0.045 | -0.2930 | No | ||
| 4 | KCNS3 | 4150039 | 8526 | 0.012 | -0.3960 | No | ||
| 5 | KCNMB2 | 3780128 4760136 | 9230 | 0.002 | -0.4333 | No | ||
| 6 | KCNV1 | 6110332 | 9358 | 0.000 | -0.4401 | No | ||
| 7 | ADRA2A | 5340520 | 9575 | -0.003 | -0.4509 | No | ||
| 8 | SGK2 | 1850070 | 9685 | -0.004 | -0.4555 | No | ||
| 9 | KCNMB1 | 4760139 | 11425 | -0.031 | -0.5398 | No | ||
| 10 | KCNAB1 | 1580070 3290156 | 12250 | -0.048 | -0.5698 | No | ||
| 11 | ARPP-19 | 5700025 | 15945 | -0.350 | -0.6650 | Yes | ||
| 12 | KCNAB2 | 4850315 | 17944 | -1.160 | -0.4298 | Yes | ||
| 13 | KCNAB3 | 2470725 | 18303 | -1.577 | 0.0168 | Yes |