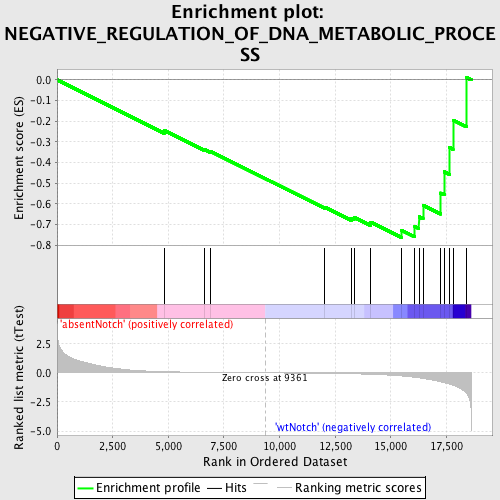
Profile of the Running ES Score & Positions of GeneSet Members on the Rank Ordered List
| Dataset | Set_03_absentNotch_versus_wtNotch.phenotype_absentNotch_versus_wtNotch.cls #absentNotch_versus_wtNotch.phenotype_absentNotch_versus_wtNotch.cls #absentNotch_versus_wtNotch_repos |
| Phenotype | phenotype_absentNotch_versus_wtNotch.cls#absentNotch_versus_wtNotch_repos |
| Upregulated in class | wtNotch |
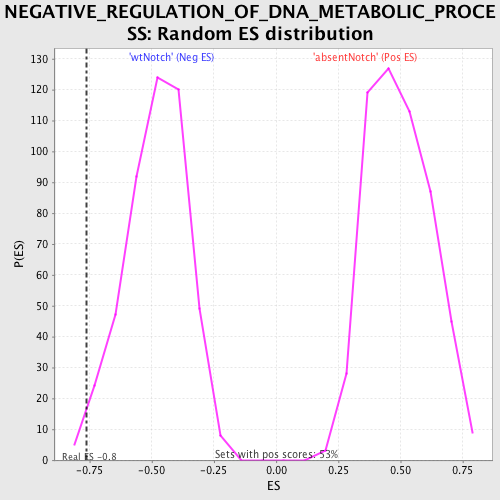
| GeneSet | NEGATIVE_REGULATION_OF_DNA_METABOLIC_PROCESS |
| Enrichment Score (ES) | -0.7631312 |
| Normalized Enrichment Score (NES) | -1.585112 |
| Nominal p-value | 0.010660981 |
| FDR q-value | 1.0 |
| FWER p-Value | 0.992 |
| PROBE | DESCRIPTION (from dataset) | GENE SYMBOL | GENE_TITLE | RANK IN GENE LIST | RANK METRIC SCORE | RUNNING ES | CORE ENRICHMENT | |
|---|---|---|---|---|---|---|---|---|
| 1 | S100A11 | 2260064 | 4811 | 0.102 | -0.2450 | No | ||
| 2 | SET | 6650286 | 6630 | 0.043 | -0.3369 | No | ||
| 3 | RAD17 | 5220739 | 6903 | 0.038 | -0.3465 | No | ||
| 4 | NF2 | 4150735 6450139 | 12019 | -0.043 | -0.6157 | No | ||
| 5 | GMNN | 2630148 | 13220 | -0.078 | -0.6697 | No | ||
| 6 | RAD9A | 110300 1940632 3990390 6040014 | 13348 | -0.084 | -0.6653 | No | ||
| 7 | CDC6 | 4570296 5360600 | 14080 | -0.120 | -0.6885 | No | ||
| 8 | TERF2IP | 580010 870364 2190358 | 15470 | -0.263 | -0.7279 | Yes | ||
| 9 | CDC45L | 70537 3130114 | 16078 | -0.378 | -0.7099 | Yes | ||
| 10 | ATR | 6860273 | 16266 | -0.428 | -0.6625 | Yes | ||
| 11 | GTPBP4 | 6840332 | 16450 | -0.482 | -0.6078 | Yes | ||
| 12 | CDT1 | 3780682 | 17231 | -0.761 | -0.5478 | Yes | ||
| 13 | TERF2 | 3840044 | 17401 | -0.837 | -0.4448 | Yes | ||
| 14 | TIPIN | 1570301 2480113 | 17643 | -0.972 | -0.3275 | Yes | ||
| 15 | ERCC1 | 3800010 4590132 4670397 | 17798 | -1.052 | -0.1948 | Yes | ||
| 16 | ERCC4 | 1570619 5720180 | 18412 | -1.782 | 0.0110 | Yes |