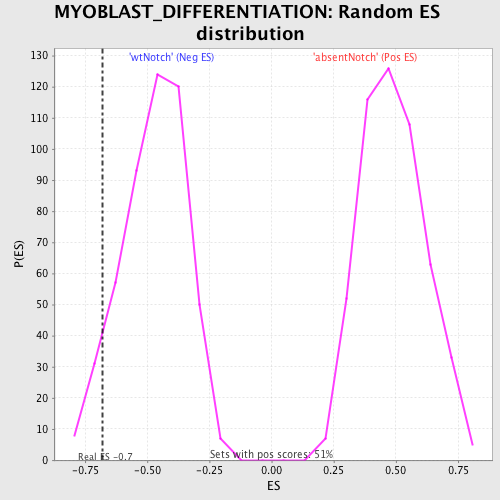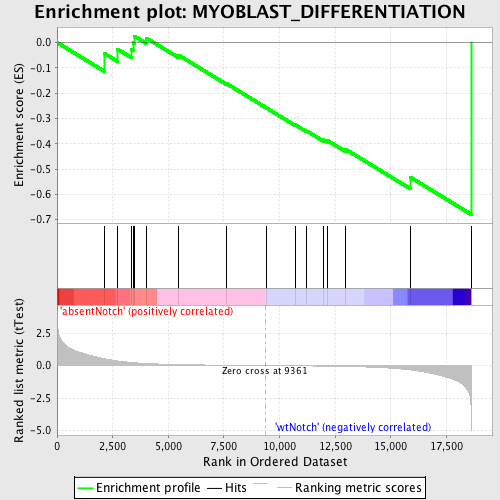
Profile of the Running ES Score & Positions of GeneSet Members on the Rank Ordered List
| Dataset | Set_03_absentNotch_versus_wtNotch.phenotype_absentNotch_versus_wtNotch.cls #absentNotch_versus_wtNotch.phenotype_absentNotch_versus_wtNotch.cls #absentNotch_versus_wtNotch_repos |
| Phenotype | phenotype_absentNotch_versus_wtNotch.cls#absentNotch_versus_wtNotch_repos |
| Upregulated in class | wtNotch |
| GeneSet | MYOBLAST_DIFFERENTIATION |
| Enrichment Score (ES) | -0.6793834 |
| Normalized Enrichment Score (NES) | -1.4367115 |
| Nominal p-value | 0.06326531 |
| FDR q-value | 1.0 |
| FWER p-Value | 1.0 |
| PROBE | DESCRIPTION (from dataset) | GENE SYMBOL | GENE_TITLE | RANK IN GENE LIST | RANK METRIC SCORE | RUNNING ES | CORE ENRICHMENT | |
|---|---|---|---|---|---|---|---|---|
| 1 | MYEF2 | 6860484 | 2141 | 0.517 | -0.0443 | No | ||
| 2 | IFRD1 | 4590215 | 2721 | 0.356 | -0.0267 | No | ||
| 3 | MAPK12 | 450022 1340717 7050484 | 3330 | 0.236 | -0.0271 | No | ||
| 4 | ADAM12 | 3390132 4070347 | 3420 | 0.224 | -0.0013 | No | ||
| 5 | TBX3 | 2570672 | 3476 | 0.214 | 0.0251 | No | ||
| 6 | KCNH1 | 4070619 6660181 | 4032 | 0.155 | 0.0165 | No | ||
| 7 | MBNL1 | 2640762 7100048 | 5455 | 0.075 | -0.0496 | No | ||
| 8 | MYH11 | 7100273 | 7632 | 0.025 | -0.1632 | No | ||
| 9 | IGFBP3 | 2370500 | 9391 | -0.000 | -0.2576 | No | ||
| 10 | BOC | 5270348 | 10698 | -0.019 | -0.3252 | No | ||
| 11 | ACTA1 | 840538 | 11227 | -0.028 | -0.3498 | No | ||
| 12 | TTN | 2320161 4670056 6550026 | 11975 | -0.042 | -0.3842 | No | ||
| 13 | MYOZ1 | 2760670 | 12149 | -0.046 | -0.3872 | No | ||
| 14 | BMP4 | 380113 | 12965 | -0.069 | -0.4216 | No | ||
| 15 | CACNA1H | 1230279 | 15873 | -0.335 | -0.5320 | Yes | ||
| 16 | NOTCH1 | 3390114 | 18616 | -4.962 | 0.0000 | Yes |