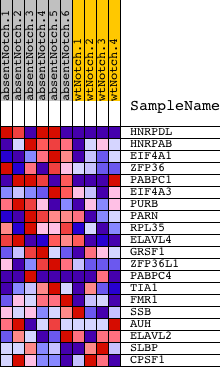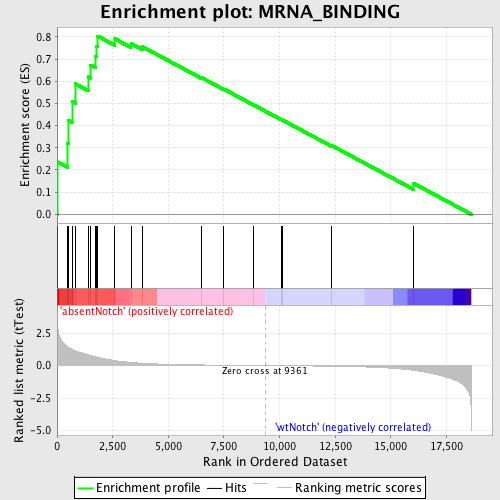
Profile of the Running ES Score & Positions of GeneSet Members on the Rank Ordered List
| Dataset | Set_03_absentNotch_versus_wtNotch.phenotype_absentNotch_versus_wtNotch.cls #absentNotch_versus_wtNotch.phenotype_absentNotch_versus_wtNotch.cls #absentNotch_versus_wtNotch_repos |
| Phenotype | phenotype_absentNotch_versus_wtNotch.cls#absentNotch_versus_wtNotch_repos |
| Upregulated in class | absentNotch |
| GeneSet | MRNA_BINDING |
| Enrichment Score (ES) | 0.8032463 |
| Normalized Enrichment Score (NES) | 1.732151 |
| Nominal p-value | 0.0018315018 |
| FDR q-value | 0.34878942 |
| FWER p-Value | 0.282 |
| PROBE | DESCRIPTION (from dataset) | GENE SYMBOL | GENE_TITLE | RANK IN GENE LIST | RANK METRIC SCORE | RUNNING ES | CORE ENRICHMENT | |
|---|---|---|---|---|---|---|---|---|
| 1 | HNRPDL | 1050102 1090181 5360471 | 17 | 3.143 | 0.2362 | Yes | ||
| 2 | HNRPAB | 540504 | 475 | 1.442 | 0.3205 | Yes | ||
| 3 | EIF4A1 | 1990341 2810300 | 512 | 1.391 | 0.4235 | Yes | ||
| 4 | ZFP36 | 2030605 | 675 | 1.248 | 0.5090 | Yes | ||
| 5 | PABPC1 | 2650180 2690253 6020632 1990270 | 819 | 1.149 | 0.5880 | Yes | ||
| 6 | EIF4A3 | 3440538 | 1395 | 0.827 | 0.6195 | Yes | ||
| 7 | PURB | 5360138 | 1492 | 0.778 | 0.6730 | Yes | ||
| 8 | PARN | 3840129 | 1724 | 0.676 | 0.7116 | Yes | ||
| 9 | RPL35 | 6940070 | 1769 | 0.655 | 0.7586 | Yes | ||
| 10 | ELAVL4 | 50735 3360086 5220167 | 1829 | 0.633 | 0.8032 | Yes | ||
| 11 | GRSF1 | 2100184 | 2600 | 0.386 | 0.7910 | No | ||
| 12 | ZFP36L1 | 2510138 4120048 | 3322 | 0.236 | 0.7701 | No | ||
| 13 | PABPC4 | 1990170 6760270 5390138 | 3844 | 0.171 | 0.7550 | No | ||
| 14 | TIA1 | 4670373 | 6486 | 0.047 | 0.6165 | No | ||
| 15 | FMR1 | 5050075 | 7485 | 0.028 | 0.5649 | No | ||
| 16 | SSB | 460286 3140717 | 8816 | 0.007 | 0.4939 | No | ||
| 17 | AUH | 5570152 | 10096 | -0.010 | 0.4259 | No | ||
| 18 | ELAVL2 | 360181 | 10145 | -0.011 | 0.4242 | No | ||
| 19 | SLBP | 6220601 | 12332 | -0.051 | 0.3104 | No | ||
| 20 | CPSF1 | 6290064 | 16008 | -0.363 | 0.1402 | No |