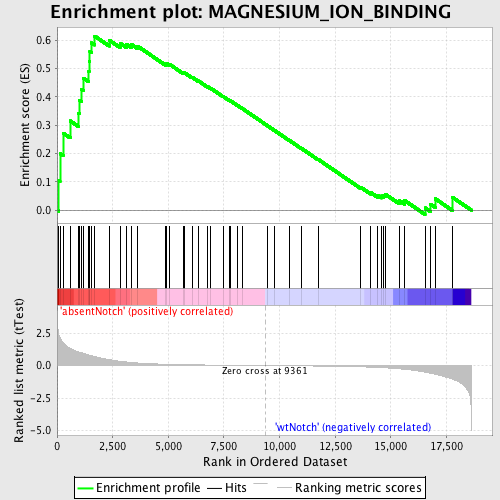
Profile of the Running ES Score & Positions of GeneSet Members on the Rank Ordered List
| Dataset | Set_03_absentNotch_versus_wtNotch.phenotype_absentNotch_versus_wtNotch.cls #absentNotch_versus_wtNotch.phenotype_absentNotch_versus_wtNotch.cls #absentNotch_versus_wtNotch_repos |
| Phenotype | phenotype_absentNotch_versus_wtNotch.cls#absentNotch_versus_wtNotch_repos |
| Upregulated in class | absentNotch |
| GeneSet | MAGNESIUM_ION_BINDING |
| Enrichment Score (ES) | 0.6144451 |
| Normalized Enrichment Score (NES) | 1.5658798 |
| Nominal p-value | 0.0054545454 |
| FDR q-value | 1.0 |
| FWER p-Value | 0.998 |
| PROBE | DESCRIPTION (from dataset) | GENE SYMBOL | GENE_TITLE | RANK IN GENE LIST | RANK METRIC SCORE | RUNNING ES | CORE ENRICHMENT | |
|---|---|---|---|---|---|---|---|---|
| 1 | TESC | 6550273 | 74 | 2.385 | 0.1050 | Yes | ||
| 2 | SRPK1 | 450110 | 132 | 2.155 | 0.2003 | Yes | ||
| 3 | MAST2 | 6200348 | 272 | 1.734 | 0.2721 | Yes | ||
| 4 | STK4 | 2640152 | 591 | 1.319 | 0.3152 | Yes | ||
| 5 | MTHFD2 | 3800411 | 965 | 1.039 | 0.3426 | Yes | ||
| 6 | PRKACB | 4210170 | 995 | 1.021 | 0.3877 | Yes | ||
| 7 | STK11 | 6550278 | 1099 | 0.985 | 0.4271 | Yes | ||
| 8 | DYRK3 | 1090014 | 1180 | 0.947 | 0.4661 | Yes | ||
| 9 | IRAK3 | 4050102 | 1424 | 0.814 | 0.4901 | Yes | ||
| 10 | CDC42BPB | 6350037 | 1439 | 0.805 | 0.5262 | Yes | ||
| 11 | MSH2 | 6180273 | 1472 | 0.787 | 0.5604 | Yes | ||
| 12 | ICK | 1580746 3140021 | 1551 | 0.752 | 0.5906 | Yes | ||
| 13 | NME1 | 770014 | 1692 | 0.688 | 0.6144 | Yes | ||
| 14 | CERK | 110397 670168 | 2344 | 0.454 | 0.6001 | No | ||
| 15 | FIGNL1 | 6860390 | 2833 | 0.331 | 0.5890 | No | ||
| 16 | NEK6 | 3360687 | 3118 | 0.272 | 0.5861 | No | ||
| 17 | MAPK12 | 450022 1340717 7050484 | 3330 | 0.236 | 0.5855 | No | ||
| 18 | MARK1 | 450484 | 3618 | 0.198 | 0.5791 | No | ||
| 19 | SRPK2 | 6380341 | 4887 | 0.098 | 0.5153 | No | ||
| 20 | TSSK1A | 4480537 | 4929 | 0.097 | 0.5175 | No | ||
| 21 | ERN2 | 7000411 | 5035 | 0.092 | 0.5160 | No | ||
| 22 | CDC42BPA | 840671 | 5669 | 0.068 | 0.4850 | No | ||
| 23 | STK38L | 840133 | 5730 | 0.066 | 0.4848 | No | ||
| 24 | SNF1LK | 6110403 | 6067 | 0.056 | 0.4693 | No | ||
| 25 | ABL2 | 580021 | 6351 | 0.050 | 0.4564 | No | ||
| 26 | TSSK3 | 1740673 | 6766 | 0.041 | 0.4359 | No | ||
| 27 | MAP3K5 | 6020041 6380162 | 6904 | 0.038 | 0.4303 | No | ||
| 28 | SNF1LK2 | 4280739 2480463 | 7457 | 0.028 | 0.4018 | No | ||
| 29 | TGM3 | 840576 | 7762 | 0.023 | 0.3865 | No | ||
| 30 | NLK | 2030010 2450041 | 7808 | 0.022 | 0.3851 | No | ||
| 31 | SPHK1 | 2470113 4230398 6220397 | 8089 | 0.018 | 0.3709 | No | ||
| 32 | MAP3K6 | 6400390 | 8339 | 0.014 | 0.3581 | No | ||
| 33 | NLRC4 | 5570332 | 9470 | -0.002 | 0.2973 | No | ||
| 34 | MOV10L1 | 4050411 | 9770 | -0.005 | 0.2815 | No | ||
| 35 | MAP2K7 | 2260086 | 10424 | -0.015 | 0.2470 | No | ||
| 36 | TSSK2 | 5220324 | 10979 | -0.024 | 0.2182 | No | ||
| 37 | GCLC | 2810731 | 11738 | -0.038 | 0.1791 | No | ||
| 38 | STK38 | 7100114 | 13649 | -0.096 | 0.0807 | No | ||
| 39 | SNRK | 630021 2030731 6350017 | 14091 | -0.121 | 0.0625 | No | ||
| 40 | STK3 | 7100427 | 14399 | -0.142 | 0.0524 | No | ||
| 41 | TSSK6 | 2190136 | 14576 | -0.158 | 0.0501 | No | ||
| 42 | MSH6 | 4480064 6520093 | 14677 | -0.166 | 0.0524 | No | ||
| 43 | BRSK2 | 4050292 | 14767 | -0.175 | 0.0556 | No | ||
| 44 | ERN1 | 2360403 | 15379 | -0.247 | 0.0340 | No | ||
| 45 | MARK2 | 7210608 | 15621 | -0.288 | 0.0342 | No | ||
| 46 | MAST1 | 6940215 | 16539 | -0.507 | 0.0079 | No | ||
| 47 | ABL1 | 1050593 2030050 4010114 | 16784 | -0.585 | 0.0215 | No | ||
| 48 | HPRT1 | 1690398 4920619 6350170 | 16997 | -0.663 | 0.0404 | No | ||
| 49 | PINK1 | 380044 580577 | 17763 | -1.024 | 0.0459 | No |

