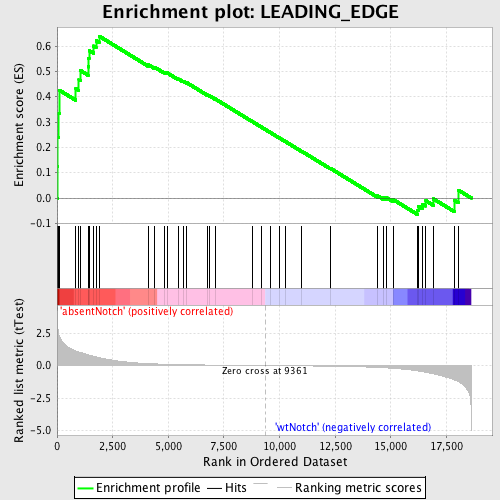
Profile of the Running ES Score & Positions of GeneSet Members on the Rank Ordered List
| Dataset | Set_03_absentNotch_versus_wtNotch.phenotype_absentNotch_versus_wtNotch.cls #absentNotch_versus_wtNotch.phenotype_absentNotch_versus_wtNotch.cls #absentNotch_versus_wtNotch_repos |
| Phenotype | phenotype_absentNotch_versus_wtNotch.cls#absentNotch_versus_wtNotch_repos |
| Upregulated in class | absentNotch |
| GeneSet | LEADING_EDGE |
| Enrichment Score (ES) | 0.6390222 |
| Normalized Enrichment Score (NES) | 1.5819417 |
| Nominal p-value | 0.007751938 |
| FDR q-value | 1.0 |
| FWER p-Value | 0.992 |
| PROBE | DESCRIPTION (from dataset) | GENE SYMBOL | GENE_TITLE | RANK IN GENE LIST | RANK METRIC SCORE | RUNNING ES | CORE ENRICHMENT | |
|---|---|---|---|---|---|---|---|---|
| 1 | CXCR4 | 4590519 | 22 | 3.106 | 0.1254 | Yes | ||
| 2 | ITGB1 | 5080156 6270528 | 36 | 2.818 | 0.2396 | Yes | ||
| 3 | TESC | 6550273 | 74 | 2.385 | 0.3348 | Yes | ||
| 4 | CYFIP1 | 5690082 | 95 | 2.260 | 0.4259 | Yes | ||
| 5 | ARF6 | 3520026 | 843 | 1.123 | 0.4314 | Yes | ||
| 6 | S100A6 | 1690204 | 980 | 1.028 | 0.4660 | Yes | ||
| 7 | NME2 | 2190672 | 1042 | 1.002 | 0.5036 | Yes | ||
| 8 | PDPN | 4640280 | 1396 | 0.827 | 0.5183 | Yes | ||
| 9 | EVL | 1740113 | 1419 | 0.818 | 0.5504 | Yes | ||
| 10 | CDC42BPB | 6350037 | 1439 | 0.805 | 0.5822 | Yes | ||
| 11 | MYO6 | 2190332 | 1643 | 0.707 | 0.6001 | Yes | ||
| 12 | WASF2 | 4850592 | 1753 | 0.665 | 0.6214 | Yes | ||
| 13 | CDK6 | 4920253 | 1888 | 0.610 | 0.6390 | Yes | ||
| 14 | APBB2 | 5130403 | 4087 | 0.150 | 0.5268 | No | ||
| 15 | CTTN | 780154 1690538 3310017 4060717 | 4377 | 0.128 | 0.5165 | No | ||
| 16 | S100A11 | 2260064 | 4811 | 0.102 | 0.4973 | No | ||
| 17 | FGD2 | 5340195 | 4940 | 0.096 | 0.4944 | No | ||
| 18 | PIB5PA | 6900427 | 5453 | 0.076 | 0.4699 | No | ||
| 19 | CDC42BPA | 840671 | 5669 | 0.068 | 0.4611 | No | ||
| 20 | ITGA5 | 5550520 | 5820 | 0.064 | 0.4556 | No | ||
| 21 | BCAR1 | 1340215 | 6757 | 0.041 | 0.4069 | No | ||
| 22 | ITGB1BP1 | 3830121 | 6848 | 0.039 | 0.4036 | No | ||
| 23 | FGD1 | 4780021 | 7103 | 0.034 | 0.3914 | No | ||
| 24 | FGD5 | 3520438 4060500 | 8794 | 0.008 | 0.3007 | No | ||
| 25 | FAP | 4560019 | 9178 | 0.003 | 0.2802 | No | ||
| 26 | APBB1 | 2690338 | 9605 | -0.003 | 0.2574 | No | ||
| 27 | CD2AP | 1940369 | 10002 | -0.009 | 0.2364 | No | ||
| 28 | ABI3 | 1740563 | 10272 | -0.013 | 0.2224 | No | ||
| 29 | FGD4 | 520168 870411 2640253 6550338 6650364 | 10998 | -0.024 | 0.1844 | No | ||
| 30 | S100B | 6520088 | 12285 | -0.049 | 0.1172 | No | ||
| 31 | FGD6 | 610632 | 14403 | -0.142 | 0.0090 | No | ||
| 32 | MYO5A | 2900288 5270333 | 14680 | -0.167 | 0.0010 | No | ||
| 33 | AMOT | 1940121 2940647 6590093 | 14791 | -0.178 | 0.0023 | No | ||
| 34 | FGD3 | 5690465 | 15123 | -0.213 | -0.0068 | No | ||
| 35 | TSC1 | 1850672 | 16201 | -0.410 | -0.0481 | No | ||
| 36 | ABI1 | 2850152 | 16250 | -0.423 | -0.0335 | No | ||
| 37 | ALS2 | 3130546 6400070 | 16426 | -0.474 | -0.0236 | No | ||
| 38 | TLN1 | 6590411 | 16573 | -0.517 | -0.0104 | No | ||
| 39 | MYH9 | 3120091 4850292 | 16916 | -0.628 | -0.0032 | No | ||
| 40 | DBNL | 7100088 | 17848 | -1.089 | -0.0089 | No | ||
| 41 | ARFIP2 | 1850301 4670180 | 18032 | -1.232 | 0.0314 | No |

