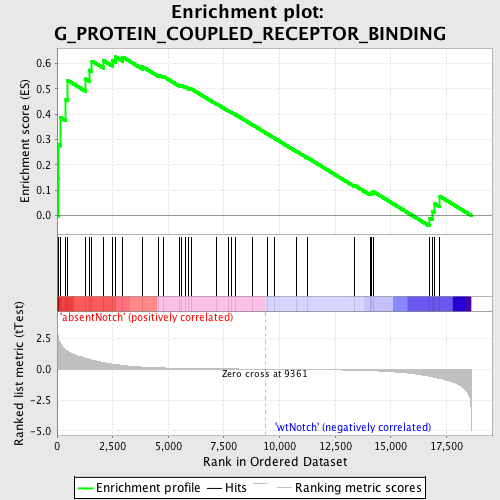
Profile of the Running ES Score & Positions of GeneSet Members on the Rank Ordered List
| Dataset | Set_03_absentNotch_versus_wtNotch.phenotype_absentNotch_versus_wtNotch.cls #absentNotch_versus_wtNotch.phenotype_absentNotch_versus_wtNotch.cls #absentNotch_versus_wtNotch_repos |
| Phenotype | phenotype_absentNotch_versus_wtNotch.cls#absentNotch_versus_wtNotch_repos |
| Upregulated in class | absentNotch |
| GeneSet | G_PROTEIN_COUPLED_RECEPTOR_BINDING |
| Enrichment Score (ES) | 0.6262269 |
| Normalized Enrichment Score (NES) | 1.5156791 |
| Nominal p-value | 0.02745098 |
| FDR q-value | 0.8945897 |
| FWER p-Value | 1.0 |
| PROBE | DESCRIPTION (from dataset) | GENE SYMBOL | GENE_TITLE | RANK IN GENE LIST | RANK METRIC SCORE | RUNNING ES | CORE ENRICHMENT | |
|---|---|---|---|---|---|---|---|---|
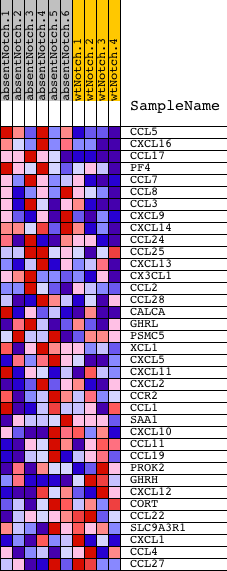
| 1 | CCL5 | 3710397 | 42 | 2.710 | 0.1476 | Yes | ||
| 2 | CXCL16 | 510278 | 72 | 2.411 | 0.2794 | Yes | ||
| 3 | CCL17 | 630121 | 166 | 2.016 | 0.3859 | Yes | ||
| 4 | PF4 | 6130332 | 396 | 1.542 | 0.4588 | Yes | ||
| 5 | CCL7 | 2650519 | 482 | 1.429 | 0.5333 | Yes | ||
| 6 | CCL8 | 3870010 | 1283 | 0.881 | 0.5390 | Yes | ||
| 7 | CCL3 | 2810092 | 1448 | 0.800 | 0.5744 | Yes | ||
| 8 | CXCL9 | 1570673 | 1563 | 0.750 | 0.6097 | Yes | ||
| 9 | CXCL14 | 840114 6450324 | 2076 | 0.542 | 0.6121 | Yes | ||
| 10 | CCL24 | 670129 | 2487 | 0.413 | 0.6128 | Yes | ||
| 11 | CCL25 | 450541 540435 | 2628 | 0.378 | 0.6262 | Yes | ||
| 12 | CXCL13 | 6290402 | 2958 | 0.302 | 0.6252 | No | ||
| 13 | CX3CL1 | 3990707 | 3843 | 0.171 | 0.5871 | No | ||
| 14 | CCL2 | 4760019 | 4568 | 0.116 | 0.5546 | No | ||
| 15 | CCL28 | 2690593 | 4774 | 0.104 | 0.5493 | No | ||
| 16 | CALCA | 5860167 | 5514 | 0.073 | 0.5135 | No | ||
| 17 | GHRL | 2360619 6760438 | 5601 | 0.071 | 0.5128 | No | ||
| 18 | PSMC5 | 2760315 6550021 | 5751 | 0.066 | 0.5084 | No | ||
| 19 | XCL1 | 3800504 | 5926 | 0.061 | 0.5024 | No | ||
| 20 | CXCL5 | 6370333 | 6039 | 0.057 | 0.4996 | No | ||
| 21 | CXCL11 | 1090551 | 7167 | 0.033 | 0.4407 | No | ||
| 22 | CXCL2 | 610398 | 7697 | 0.024 | 0.4136 | No | ||
| 23 | CCR2 | 1450519 | 7857 | 0.022 | 0.4062 | No | ||
| 24 | CCL1 | 4230167 | 8037 | 0.019 | 0.3976 | No | ||
| 25 | SAA1 | 5390520 | 8797 | 0.008 | 0.3572 | No | ||
| 26 | CXCL10 | 2450408 | 9447 | -0.001 | 0.3223 | No | ||
| 27 | CCL11 | 1770347 | 9760 | -0.005 | 0.3058 | No | ||
| 28 | CCL19 | 5080487 | 10760 | -0.020 | 0.2532 | No | ||
| 29 | PROK2 | 540538 | 11264 | -0.028 | 0.2277 | No | ||
| 30 | GHRH | 4570575 | 13368 | -0.085 | 0.1192 | No | ||
| 31 | CXCL12 | 580546 4150750 4570068 | 14067 | -0.120 | 0.0882 | No | ||
| 32 | CORT | 360008 2340092 | 14138 | -0.124 | 0.0913 | No | ||
| 33 | CCL22 | 6380086 | 14221 | -0.130 | 0.0941 | No | ||
| 34 | SLC9A3R1 | 6020373 | 16735 | -0.568 | -0.0097 | No | ||
| 35 | CXCL1 | 2690537 | 16871 | -0.610 | 0.0168 | No | ||
| 36 | CCL4 | 50368 430047 | 16950 | -0.642 | 0.0481 | No | ||
| 37 | CCL27 | 2120070 | 17207 | -0.751 | 0.0758 | No |