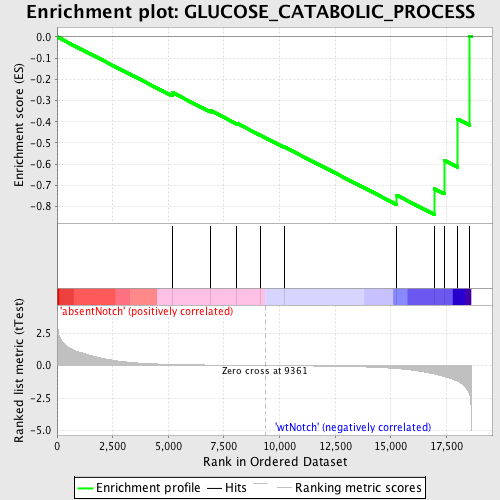
Profile of the Running ES Score & Positions of GeneSet Members on the Rank Ordered List
| Dataset | Set_03_absentNotch_versus_wtNotch.phenotype_absentNotch_versus_wtNotch.cls #absentNotch_versus_wtNotch.phenotype_absentNotch_versus_wtNotch.cls #absentNotch_versus_wtNotch_repos |
| Phenotype | phenotype_absentNotch_versus_wtNotch.cls#absentNotch_versus_wtNotch_repos |
| Upregulated in class | wtNotch |
| GeneSet | GLUCOSE_CATABOLIC_PROCESS |
| Enrichment Score (ES) | -0.8372554 |
| Normalized Enrichment Score (NES) | -1.5661731 |
| Nominal p-value | 0.006263048 |
| FDR q-value | 1.0 |
| FWER p-Value | 0.999 |
| PROBE | DESCRIPTION (from dataset) | GENE SYMBOL | GENE_TITLE | RANK IN GENE LIST | RANK METRIC SCORE | RUNNING ES | CORE ENRICHMENT | |
|---|---|---|---|---|---|---|---|---|
| 1 | TKTL1 | 2810672 6760102 | 5180 | 0.086 | -0.2622 | No | ||
| 2 | PFKL | 6200167 | 6892 | 0.038 | -0.3469 | No | ||
| 3 | ALDOB | 4730324 | 8081 | 0.018 | -0.4073 | No | ||
| 4 | PFKFB1 | 2370128 | 9120 | 0.004 | -0.4625 | No | ||
| 5 | GAPDHS | 2690463 | 10205 | -0.012 | -0.5185 | No | ||
| 6 | HK1 | 4280402 | 15271 | -0.232 | -0.7469 | Yes | ||
| 7 | PFKM | 1990156 5720168 | 16954 | -0.643 | -0.7159 | Yes | ||
| 8 | PGD | 6840048 | 17399 | -0.835 | -0.5820 | Yes | ||
| 9 | PGLS | 2120324 | 17997 | -1.201 | -0.3874 | Yes | ||
| 10 | ALDOA | 6290672 | 18544 | -2.228 | 0.0039 | Yes |

