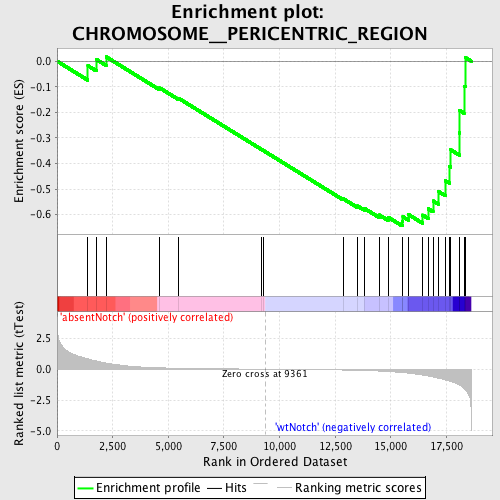
Profile of the Running ES Score & Positions of GeneSet Members on the Rank Ordered List
| Dataset | Set_03_absentNotch_versus_wtNotch.phenotype_absentNotch_versus_wtNotch.cls #absentNotch_versus_wtNotch.phenotype_absentNotch_versus_wtNotch.cls #absentNotch_versus_wtNotch_repos |
| Phenotype | phenotype_absentNotch_versus_wtNotch.cls#absentNotch_versus_wtNotch_repos |
| Upregulated in class | wtNotch |
| GeneSet | CHROMOSOME__PERICENTRIC_REGION |
| Enrichment Score (ES) | -0.6446314 |
| Normalized Enrichment Score (NES) | -1.4928854 |
| Nominal p-value | 0.029535865 |
| FDR q-value | 1.0 |
| FWER p-Value | 1.0 |
| PROBE | DESCRIPTION (from dataset) | GENE SYMBOL | GENE_TITLE | RANK IN GENE LIST | RANK METRIC SCORE | RUNNING ES | CORE ENRICHMENT | |
|---|---|---|---|---|---|---|---|---|
| 1 | ZWINT | 6940670 | 1385 | 0.833 | -0.0177 | No | ||
| 2 | ZW10 | 2900735 3520687 | 1764 | 0.658 | 0.0069 | No | ||
| 3 | CLASP1 | 6860279 | 2207 | 0.498 | 0.0171 | No | ||
| 4 | CLIP1 | 2850162 6770397 | 4611 | 0.113 | -0.1045 | No | ||
| 5 | CENPE | 2850022 | 5444 | 0.076 | -0.1440 | No | ||
| 6 | HELLS | 4560086 4810025 | 9173 | 0.003 | -0.3444 | No | ||
| 7 | CENPF | 5050088 | 9298 | 0.001 | -0.3510 | No | ||
| 8 | CENPC1 | 610273 | 12863 | -0.065 | -0.5383 | No | ||
| 9 | MAD2L1 | 4480725 | 13497 | -0.090 | -0.5662 | No | ||
| 10 | PAFAH1B1 | 4230333 6420121 6450066 | 13822 | -0.106 | -0.5764 | No | ||
| 11 | BUB1 | 5390270 | 14477 | -0.149 | -0.6015 | No | ||
| 12 | PSEN2 | 130382 | 14880 | -0.186 | -0.6104 | No | ||
| 13 | SUMO3 | 130600 3710136 | 15517 | -0.273 | -0.6260 | Yes | ||
| 14 | APC | 3850484 5860722 | 15544 | -0.277 | -0.6085 | Yes | ||
| 15 | KIF22 | 1190368 | 15799 | -0.321 | -0.6003 | Yes | ||
| 16 | BUB1B | 1450288 | 16427 | -0.474 | -0.6017 | Yes | ||
| 17 | PMF1 | 5130273 | 16683 | -0.555 | -0.5775 | Yes | ||
| 18 | SUGT1 | 1690670 | 16900 | -0.622 | -0.5467 | Yes | ||
| 19 | NDC80 | 4120465 | 17153 | -0.727 | -0.5107 | Yes | ||
| 20 | CENPA | 5080154 | 17459 | -0.868 | -0.4678 | Yes | ||
| 21 | INCENP | 520593 | 17634 | -0.963 | -0.4115 | Yes | ||
| 22 | PSEN1 | 130403 2030647 6100603 | 17694 | -0.996 | -0.3468 | Yes | ||
| 23 | BUB3 | 3170546 | 18081 | -1.277 | -0.2804 | Yes | ||
| 24 | DCTN2 | 540471 3780717 | 18096 | -1.294 | -0.1929 | Yes | ||
| 25 | BIRC5 | 110408 580014 1770632 | 18295 | -1.558 | -0.0972 | Yes | ||
| 26 | SMC1A | 3060600 5700148 5890113 6370154 | 18356 | -1.678 | 0.0140 | Yes |

