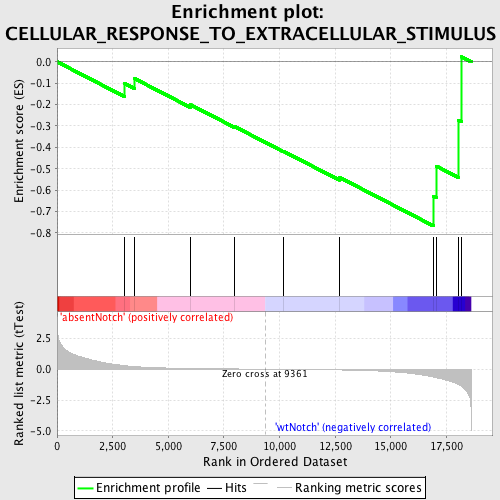
Profile of the Running ES Score & Positions of GeneSet Members on the Rank Ordered List
| Dataset | Set_03_absentNotch_versus_wtNotch.phenotype_absentNotch_versus_wtNotch.cls #absentNotch_versus_wtNotch.phenotype_absentNotch_versus_wtNotch.cls #absentNotch_versus_wtNotch_repos |
| Phenotype | phenotype_absentNotch_versus_wtNotch.cls#absentNotch_versus_wtNotch_repos |
| Upregulated in class | wtNotch |
| GeneSet | CELLULAR_RESPONSE_TO_EXTRACELLULAR_STIMULUS |
| Enrichment Score (ES) | -0.76761776 |
| Normalized Enrichment Score (NES) | -1.4388796 |
| Nominal p-value | 0.05668016 |
| FDR q-value | 1.0 |
| FWER p-Value | 1.0 |
| PROBE | DESCRIPTION (from dataset) | GENE SYMBOL | GENE_TITLE | RANK IN GENE LIST | RANK METRIC SCORE | RUNNING ES | CORE ENRICHMENT | |
|---|---|---|---|---|---|---|---|---|
| 1 | CDKN2B | 6020040 | 3040 | 0.285 | -0.1011 | No | ||
| 2 | CDKN1A | 4050088 6400706 | 3489 | 0.212 | -0.0788 | No | ||
| 3 | FADS1 | 5270537 | 5983 | 0.059 | -0.1999 | No | ||
| 4 | PCSK9 | 3120044 | 7970 | 0.020 | -0.3023 | No | ||
| 5 | CARTPT | 6660687 | 10161 | -0.011 | -0.4175 | No | ||
| 6 | SREBF1 | 4780333 | 12682 | -0.060 | -0.5399 | No | ||
| 7 | ASNS | 110368 7100687 | 16920 | -0.630 | -0.6300 | Yes | ||
| 8 | CHMP1A | 5550441 | 17041 | -0.682 | -0.4874 | Yes | ||
| 9 | PPP1R9B | 3130619 | 18031 | -1.227 | -0.2724 | Yes | ||
| 10 | TP53 | 6130707 | 18184 | -1.390 | 0.0232 | Yes |

