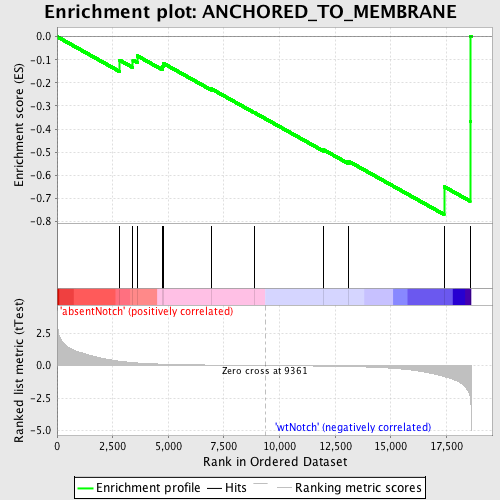
Profile of the Running ES Score & Positions of GeneSet Members on the Rank Ordered List
| Dataset | Set_03_absentNotch_versus_wtNotch.phenotype_absentNotch_versus_wtNotch.cls #absentNotch_versus_wtNotch.phenotype_absentNotch_versus_wtNotch.cls #absentNotch_versus_wtNotch_repos |
| Phenotype | phenotype_absentNotch_versus_wtNotch.cls#absentNotch_versus_wtNotch_repos |
| Upregulated in class | wtNotch |
| GeneSet | ANCHORED_TO_MEMBRANE |
| Enrichment Score (ES) | -0.7701433 |
| Normalized Enrichment Score (NES) | -1.495821 |
| Nominal p-value | 0.0392562 |
| FDR q-value | 1.0 |
| FWER p-Value | 1.0 |
| PROBE | DESCRIPTION (from dataset) | GENE SYMBOL | GENE_TITLE | RANK IN GENE LIST | RANK METRIC SCORE | RUNNING ES | CORE ENRICHMENT | |
|---|---|---|---|---|---|---|---|---|
| 1 | CD24 | 1780091 | 2797 | 0.339 | -0.1011 | No | ||
| 2 | EFNA5 | 460707 2190519 | 3409 | 0.225 | -0.1014 | No | ||
| 3 | NTNG1 | 50270 1410427 4810333 | 3604 | 0.199 | -0.0829 | No | ||
| 4 | PKHD1 | 70403 4810402 | 4738 | 0.105 | -0.1285 | No | ||
| 5 | MDGA1 | 1170139 | 4773 | 0.104 | -0.1153 | No | ||
| 6 | RGMB | 670504 4570450 | 6934 | 0.037 | -0.2260 | No | ||
| 7 | RTN4RL2 | 6450609 | 8864 | 0.007 | -0.3287 | No | ||
| 8 | GAS1 | 2120504 | 11979 | -0.042 | -0.4899 | No | ||
| 9 | TREH | 630079 | 13089 | -0.073 | -0.5389 | No | ||
| 10 | NTNG2 | 1770438 6380408 | 17393 | -0.833 | -0.6494 | Yes | ||
| 11 | CD160 | 4210377 | 18560 | -2.382 | -0.3667 | Yes | ||
| 12 | RTN4RL1 | 2630368 | 18572 | -2.549 | 0.0024 | Yes |

