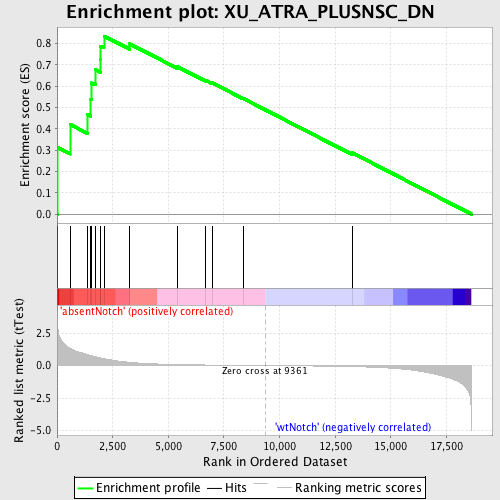
Profile of the Running ES Score & Positions of GeneSet Members on the Rank Ordered List
| Dataset | Set_03_absentNotch_versus_wtNotch.phenotype_absentNotch_versus_wtNotch.cls #absentNotch_versus_wtNotch.phenotype_absentNotch_versus_wtNotch.cls #absentNotch_versus_wtNotch_repos |
| Phenotype | phenotype_absentNotch_versus_wtNotch.cls#absentNotch_versus_wtNotch_repos |
| Upregulated in class | absentNotch |
| GeneSet | XU_ATRA_PLUSNSC_DN |
| Enrichment Score (ES) | 0.83516437 |
| Normalized Enrichment Score (NES) | 1.7033584 |
| Nominal p-value | 0.0037523452 |
| FDR q-value | 0.09578511 |
| FWER p-Value | 0.584 |
| PROBE | DESCRIPTION (from dataset) | GENE SYMBOL | GENE_TITLE | RANK IN GENE LIST | RANK METRIC SCORE | RUNNING ES | CORE ENRICHMENT | |
|---|---|---|---|---|---|---|---|---|
| 1 | DDX18 | 6980619 | 30 | 2.998 | 0.3117 | Yes | ||
| 2 | EIF3S8 | 4230671 4280373 | 580 | 1.328 | 0.4210 | Yes | ||
| 3 | PRMT1 | 2850050 | 1359 | 0.845 | 0.4674 | Yes | ||
| 4 | RUVBL2 | 1190377 | 1519 | 0.768 | 0.5391 | Yes | ||
| 5 | EIF3S9 | 2030068 2120044 | 1560 | 0.750 | 0.6154 | Yes | ||
| 6 | CSE1L | 3850086 | 1715 | 0.679 | 0.6781 | Yes | ||
| 7 | EIF4E | 1580403 70133 6380215 | 1940 | 0.587 | 0.7274 | Yes | ||
| 8 | PPM1G | 610725 | 1944 | 0.586 | 0.7885 | Yes | ||
| 9 | RABGGTB | 3120037 | 2108 | 0.530 | 0.8352 | Yes | ||
| 10 | MYC | 380541 4670170 | 3258 | 0.246 | 0.7991 | No | ||
| 11 | APPBP1 | 870707 2120017 | 5396 | 0.077 | 0.6923 | No | ||
| 12 | ABCE1 | 4280050 | 6660 | 0.043 | 0.6289 | No | ||
| 13 | GRB10 | 6980082 | 6968 | 0.037 | 0.6162 | No | ||
| 14 | EIF4EBP1 | 60132 5720148 | 8355 | 0.014 | 0.5432 | No | ||
| 15 | DDX10 | 520746 | 13265 | -0.080 | 0.2877 | No |

