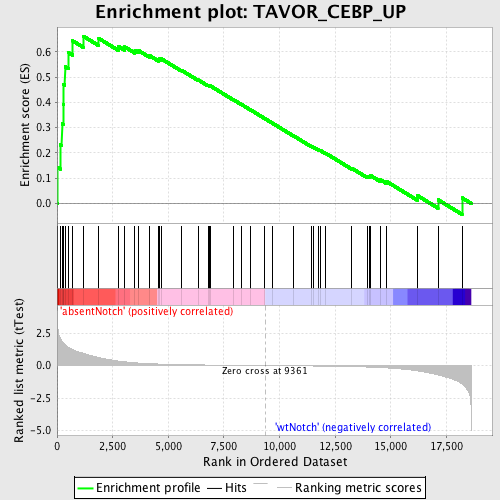
Profile of the Running ES Score & Positions of GeneSet Members on the Rank Ordered List
| Dataset | Set_03_absentNotch_versus_wtNotch.phenotype_absentNotch_versus_wtNotch.cls #absentNotch_versus_wtNotch.phenotype_absentNotch_versus_wtNotch.cls #absentNotch_versus_wtNotch_repos |
| Phenotype | phenotype_absentNotch_versus_wtNotch.cls#absentNotch_versus_wtNotch_repos |
| Upregulated in class | absentNotch |
| GeneSet | TAVOR_CEBP_UP |
| Enrichment Score (ES) | 0.6627902 |
| Normalized Enrichment Score (NES) | 1.6465921 |
| Nominal p-value | 0.0018691589 |
| FDR q-value | 0.17007494 |
| FWER p-Value | 0.911 |
| PROBE | DESCRIPTION (from dataset) | GENE SYMBOL | GENE_TITLE | RANK IN GENE LIST | RANK METRIC SCORE | RUNNING ES | CORE ENRICHMENT | |
|---|---|---|---|---|---|---|---|---|
| 1 | CXCR4 | 4590519 | 22 | 3.106 | 0.1425 | Yes | ||
| 2 | HMOX1 | 1740687 | 142 | 2.093 | 0.2329 | Yes | ||
| 3 | LITAF | 6940671 | 219 | 1.886 | 0.3160 | Yes | ||
| 4 | VCL | 4120487 | 273 | 1.734 | 0.3933 | Yes | ||
| 5 | LST1 | 5420372 | 288 | 1.714 | 0.4719 | Yes | ||
| 6 | EXTL2 | 5050433 | 354 | 1.585 | 0.5417 | Yes | ||
| 7 | AKAP12 | 1450739 | 522 | 1.383 | 0.5967 | Yes | ||
| 8 | CCND2 | 5340167 | 699 | 1.231 | 0.6441 | Yes | ||
| 9 | S100A9 | 7050528 | 1172 | 0.953 | 0.6628 | Yes | ||
| 10 | BTG1 | 4200735 6040131 6200133 | 1873 | 0.617 | 0.6536 | No | ||
| 11 | PTPRC | 130402 5290148 | 2759 | 0.346 | 0.6220 | No | ||
| 12 | ARHGEF5 | 3170605 | 3039 | 0.285 | 0.6201 | No | ||
| 13 | GLIPR1 | 3360750 | 3499 | 0.211 | 0.6052 | No | ||
| 14 | CA2 | 1660113 1660600 | 3671 | 0.192 | 0.6049 | No | ||
| 15 | RGS2 | 1090736 | 4155 | 0.144 | 0.5855 | No | ||
| 16 | TANK | 1090020 2060458 2370400 | 4565 | 0.116 | 0.5689 | No | ||
| 17 | KLF5 | 3840348 | 4594 | 0.115 | 0.5727 | No | ||
| 18 | MLC1 | 2650731 6350670 | 4685 | 0.109 | 0.5729 | No | ||
| 19 | BTG2 | 2350411 | 5583 | 0.071 | 0.5279 | No | ||
| 20 | TRIB1 | 2320435 | 6344 | 0.050 | 0.4893 | No | ||
| 21 | SERPINF1 | 7040367 | 6790 | 0.040 | 0.4672 | No | ||
| 22 | GPR109B | 5550471 | 6841 | 0.039 | 0.4663 | No | ||
| 23 | C3AR1 | 5720131 | 6872 | 0.039 | 0.4665 | No | ||
| 24 | SERTAD2 | 2810673 6840450 | 7912 | 0.021 | 0.4115 | No | ||
| 25 | ARG1 | 840707 | 8273 | 0.015 | 0.3928 | No | ||
| 26 | EEF1A2 | 2260162 5290086 | 8687 | 0.009 | 0.3710 | No | ||
| 27 | IL1RN | 2370333 | 9320 | 0.000 | 0.3370 | No | ||
| 28 | SERPINI1 | 2940468 | 9697 | -0.004 | 0.3170 | No | ||
| 29 | PTX3 | 870309 3520102 | 10611 | -0.018 | 0.2686 | No | ||
| 30 | KCNMB1 | 4760139 | 11425 | -0.031 | 0.2263 | No | ||
| 31 | SPINT2 | 2630039 6110519 | 11543 | -0.034 | 0.2216 | No | ||
| 32 | GGH | 4850373 6290152 | 11728 | -0.037 | 0.2134 | No | ||
| 33 | PTPN3 | 870369 | 11819 | -0.039 | 0.2104 | No | ||
| 34 | GBP1 | 780075 | 12056 | -0.044 | 0.1997 | No | ||
| 35 | ANXA1 | 2320053 | 13244 | -0.079 | 0.1395 | No | ||
| 36 | SECTM1 | 510541 | 13958 | -0.114 | 0.1063 | No | ||
| 37 | CD7 | 3140465 | 14030 | -0.117 | 0.1079 | No | ||
| 38 | NFIL3 | 4070377 | 14075 | -0.120 | 0.1111 | No | ||
| 39 | ACSL1 | 2900520 | 14530 | -0.154 | 0.0938 | No | ||
| 40 | ARC | 4610093 | 14812 | -0.180 | 0.0869 | No | ||
| 41 | DYNLT3 | 5570398 | 16189 | -0.406 | 0.0316 | No | ||
| 42 | SOD2 | 1410053 | 17123 | -0.717 | 0.0146 | No | ||
| 43 | GCH1 | 670364 6550358 | 18206 | -1.422 | 0.0221 | No |

