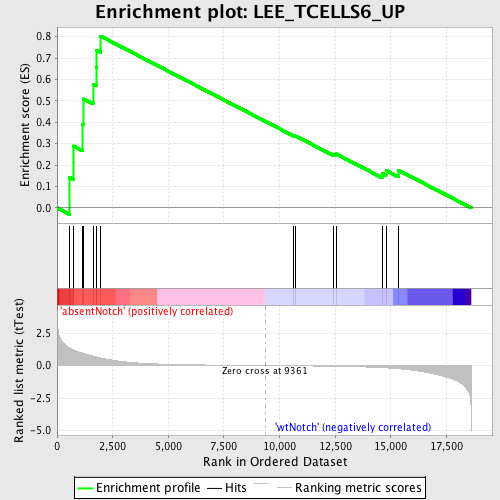
Profile of the Running ES Score & Positions of GeneSet Members on the Rank Ordered List
| Dataset | Set_03_absentNotch_versus_wtNotch.phenotype_absentNotch_versus_wtNotch.cls #absentNotch_versus_wtNotch.phenotype_absentNotch_versus_wtNotch.cls #absentNotch_versus_wtNotch_repos |
| Phenotype | phenotype_absentNotch_versus_wtNotch.cls#absentNotch_versus_wtNotch_repos |
| Upregulated in class | absentNotch |
| GeneSet | LEE_TCELLS6_UP |
| Enrichment Score (ES) | 0.80222374 |
| Normalized Enrichment Score (NES) | 1.623741 |
| Nominal p-value | 0.007490637 |
| FDR q-value | 0.20841028 |
| FWER p-Value | 0.963 |
| PROBE | DESCRIPTION (from dataset) | GENE SYMBOL | GENE_TITLE | RANK IN GENE LIST | RANK METRIC SCORE | RUNNING ES | CORE ENRICHMENT | |
|---|---|---|---|---|---|---|---|---|
| 1 | SH2D1A | 4760025 | 570 | 1.338 | 0.1408 | Yes | ||
| 2 | RIPK4 | 360019 | 721 | 1.220 | 0.2891 | Yes | ||
| 3 | RORC | 1740121 | 1155 | 0.959 | 0.3888 | Yes | ||
| 4 | SLAMF1 | 580131 4920110 | 1182 | 0.947 | 0.5087 | Yes | ||
| 5 | CIB2 | 1740131 4760594 | 1616 | 0.721 | 0.5778 | Yes | ||
| 6 | SLC7A3 | 60270 1400091 | 1765 | 0.658 | 0.6541 | Yes | ||
| 7 | BCL6 | 940100 | 1780 | 0.649 | 0.7366 | Yes | ||
| 8 | LHFPL2 | 450020 | 1951 | 0.584 | 0.8022 | Yes | ||
| 9 | CPLX1 | 2510735 | 10635 | -0.018 | 0.3378 | No | ||
| 10 | RASD1 | 2450463 | 10735 | -0.020 | 0.3350 | No | ||
| 11 | ELOVL4 | 5220333 | 12428 | -0.053 | 0.2508 | No | ||
| 12 | EFNB2 | 5340136 | 12535 | -0.056 | 0.2523 | No | ||
| 13 | DNMBP | 2810368 6900403 | 14626 | -0.163 | 0.1608 | No | ||
| 14 | CD8B | 1940411 2570035 | 14784 | -0.177 | 0.1750 | No | ||
| 15 | LYST | 3870039 7000717 | 15335 | -0.241 | 0.1764 | No |

