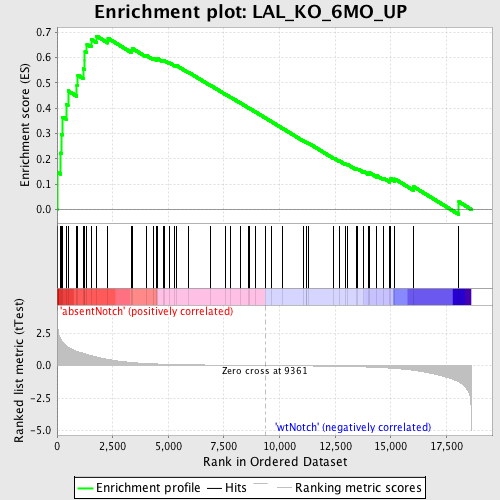
Profile of the Running ES Score & Positions of GeneSet Members on the Rank Ordered List
| Dataset | Set_03_absentNotch_versus_wtNotch.phenotype_absentNotch_versus_wtNotch.cls #absentNotch_versus_wtNotch.phenotype_absentNotch_versus_wtNotch.cls #absentNotch_versus_wtNotch_repos |
| Phenotype | phenotype_absentNotch_versus_wtNotch.cls#absentNotch_versus_wtNotch_repos |
| Upregulated in class | absentNotch |
| GeneSet | LAL_KO_6MO_UP |
| Enrichment Score (ES) | 0.684042 |
| Normalized Enrichment Score (NES) | 1.797555 |
| Nominal p-value | 0.0 |
| FDR q-value | 0.024939835 |
| FWER p-Value | 0.095 |
| PROBE | DESCRIPTION (from dataset) | GENE SYMBOL | GENE_TITLE | RANK IN GENE LIST | RANK METRIC SCORE | RUNNING ES | CORE ENRICHMENT | |
|---|---|---|---|---|---|---|---|---|
| 1 | SLC40A1 | 2370286 | 5 | 3.698 | 0.1468 | Yes | ||
| 2 | HMOX1 | 1740687 | 142 | 2.093 | 0.2227 | Yes | ||
| 3 | FCGR3A | 3840184 | 193 | 1.936 | 0.2970 | Yes | ||
| 4 | NEU1 | 380546 | 256 | 1.780 | 0.3645 | Yes | ||
| 5 | CD68 | 6350450 | 428 | 1.506 | 0.4151 | Yes | ||
| 6 | SLC11A1 | 940286 2810435 6370647 | 492 | 1.413 | 0.4679 | Yes | ||
| 7 | CTSB | 1400524 2360064 | 889 | 1.092 | 0.4900 | Yes | ||
| 8 | CD84 | 1780168 | 934 | 1.059 | 0.5298 | Yes | ||
| 9 | S100A9 | 7050528 | 1172 | 0.953 | 0.5549 | Yes | ||
| 10 | TREM2 | 6290358 | 1251 | 0.901 | 0.5865 | Yes | ||
| 11 | MMP12 | 4920070 | 1252 | 0.901 | 0.6224 | Yes | ||
| 12 | LY9 | 3360315 4070292 | 1340 | 0.853 | 0.6516 | Yes | ||
| 13 | CAMP | 6290735 | 1535 | 0.759 | 0.6713 | Yes | ||
| 14 | MARCO | 870056 | 1779 | 0.650 | 0.6840 | Yes | ||
| 15 | ADAM8 | 450347 5670609 | 2286 | 0.476 | 0.6757 | No | ||
| 16 | UTRN | 3390048 | 3331 | 0.235 | 0.6288 | No | ||
| 17 | RGS1 | 4060347 4540181 | 3385 | 0.228 | 0.6350 | No | ||
| 18 | CLEC4E | 2940102 6550735 | 3995 | 0.159 | 0.6085 | No | ||
| 19 | EMR4 | 7040711 | 4327 | 0.132 | 0.5960 | No | ||
| 20 | CCR1 | 3440672 | 4487 | 0.121 | 0.5922 | No | ||
| 21 | IL1R2 | 1410600 | 4528 | 0.118 | 0.5948 | No | ||
| 22 | IL8RB | 450592 1170537 | 4761 | 0.104 | 0.5864 | No | ||
| 23 | MMP13 | 510471 3940097 | 4816 | 0.101 | 0.5875 | No | ||
| 24 | GDF15 | 4730017 | 5056 | 0.091 | 0.5783 | No | ||
| 25 | CLCA2 | 620521 | 5287 | 0.081 | 0.5691 | No | ||
| 26 | MS4A7 | 2260465 | 5386 | 0.078 | 0.5669 | No | ||
| 27 | MMP19 | 5080377 | 5895 | 0.062 | 0.5420 | No | ||
| 28 | C3AR1 | 5720131 | 6872 | 0.039 | 0.4909 | No | ||
| 29 | GALC | 2260685 4810161 6370040 | 7549 | 0.027 | 0.4556 | No | ||
| 30 | MYRIP | 1580471 | 7796 | 0.023 | 0.4432 | No | ||
| 31 | SNX6 | 6200086 | 8226 | 0.016 | 0.4207 | No | ||
| 32 | FCER1G | 5550020 | 8594 | 0.011 | 0.4014 | No | ||
| 33 | PLA2G7 | 4730092 | 8665 | 0.010 | 0.3980 | No | ||
| 34 | DNMT3A | 4050068 4810717 | 8894 | 0.006 | 0.3860 | No | ||
| 35 | SEMA7A | 2630239 5050593 | 9388 | -0.000 | 0.3594 | No | ||
| 36 | KIF1A | 450632 | 9626 | -0.003 | 0.3468 | No | ||
| 37 | DST | 430026 1090035 2340577 3170068 3870112 4780519 6400167 6450358 7040347 | 10123 | -0.011 | 0.3205 | No | ||
| 38 | CD5L | 4070605 | 11056 | -0.025 | 0.2713 | No | ||
| 39 | CLCA1 | 1400519 | 11191 | -0.027 | 0.2651 | No | ||
| 40 | FABP7 | 4590142 | 11231 | -0.028 | 0.2641 | No | ||
| 41 | MAFB | 1230471 | 11291 | -0.029 | 0.2621 | No | ||
| 42 | SPIC | 2060017 | 12432 | -0.053 | 0.2028 | No | ||
| 43 | MSR1 | 940538 | 12681 | -0.060 | 0.1918 | No | ||
| 44 | SLC15A3 | 6650333 | 12960 | -0.069 | 0.1795 | No | ||
| 45 | TLR7 | 3140300 | 13042 | -0.072 | 0.1780 | No | ||
| 46 | MMP8 | 7100064 | 13445 | -0.088 | 0.1599 | No | ||
| 47 | LIPF | 5050368 | 13521 | -0.091 | 0.1594 | No | ||
| 48 | PAPPA | 4230463 | 13770 | -0.103 | 0.1502 | No | ||
| 49 | IGSF6 | 5340348 | 14006 | -0.116 | 0.1421 | No | ||
| 50 | SLC6A2 | 1690605 2120750 6650722 | 14039 | -0.118 | 0.1451 | No | ||
| 51 | SAA2 | 1090139 | 14373 | -0.140 | 0.1327 | No | ||
| 52 | MYO5A | 2900288 5270333 | 14680 | -0.167 | 0.1229 | No | ||
| 53 | APOBEC1 | 4610022 | 14961 | -0.194 | 0.1155 | No | ||
| 54 | TNFAIP2 | 70438 1740215 | 15001 | -0.197 | 0.1212 | No | ||
| 55 | GPNMB | 1780138 2340176 3390403 4560156 | 15185 | -0.221 | 0.1202 | No | ||
| 56 | FKBP5 | 2190048 | 16035 | -0.368 | 0.0890 | No | ||
| 57 | ACP5 | 2230717 | 18060 | -1.257 | 0.0300 | No |

