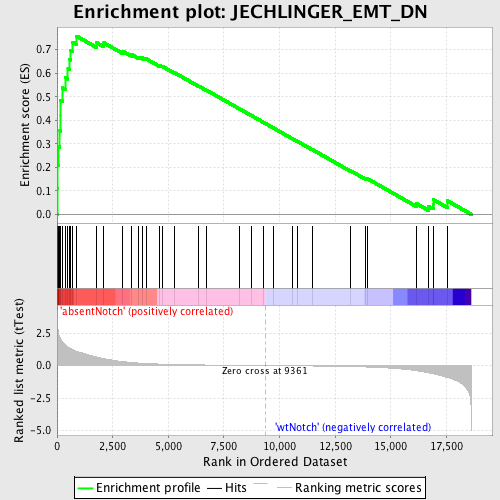
Profile of the Running ES Score & Positions of GeneSet Members on the Rank Ordered List
| Dataset | Set_03_absentNotch_versus_wtNotch.phenotype_absentNotch_versus_wtNotch.cls #absentNotch_versus_wtNotch.phenotype_absentNotch_versus_wtNotch.cls #absentNotch_versus_wtNotch_repos |
| Phenotype | phenotype_absentNotch_versus_wtNotch.cls#absentNotch_versus_wtNotch_repos |
| Upregulated in class | absentNotch |
| GeneSet | JECHLINGER_EMT_DN |
| Enrichment Score (ES) | 0.757781 |
| Normalized Enrichment Score (NES) | 1.8371527 |
| Nominal p-value | 0.0 |
| FDR q-value | 0.013521019 |
| FWER p-Value | 0.031 |
| PROBE | DESCRIPTION (from dataset) | GENE SYMBOL | GENE_TITLE | RANK IN GENE LIST | RANK METRIC SCORE | RUNNING ES | CORE ENRICHMENT | |
|---|---|---|---|---|---|---|---|---|
| 1 | TIAM1 | 5420288 | 8 | 3.482 | 0.1104 | Yes | ||
| 2 | TGM2 | 5360452 | 23 | 3.102 | 0.2084 | Yes | ||
| 3 | CTSH | 60524 | 48 | 2.594 | 0.2897 | Yes | ||
| 4 | DUSP1 | 6860121 | 125 | 2.179 | 0.3549 | Yes | ||
| 5 | ITPR1 | 3450519 | 146 | 2.077 | 0.4200 | Yes | ||
| 6 | VAMP8 | 380411 1190139 | 147 | 2.076 | 0.4861 | Yes | ||
| 7 | GRB7 | 2100471 | 249 | 1.791 | 0.5376 | Yes | ||
| 8 | PADI2 | 2940092 6420136 | 361 | 1.577 | 0.5819 | Yes | ||
| 9 | FLNA | 5390193 | 488 | 1.422 | 0.6204 | Yes | ||
| 10 | ACTN4 | 3840301 4590390 7050132 | 572 | 1.337 | 0.6585 | Yes | ||
| 11 | ITGB5 | 70129 | 618 | 1.294 | 0.6972 | Yes | ||
| 12 | JUP | 2510671 | 702 | 1.230 | 0.7319 | Yes | ||
| 13 | SGK | 1400131 2480056 | 873 | 1.100 | 0.7578 | Yes | ||
| 14 | BCL6 | 940100 | 1780 | 0.649 | 0.7297 | No | ||
| 15 | CDH1 | 1940736 | 2103 | 0.532 | 0.7293 | No | ||
| 16 | EGR2 | 3800403 | 2940 | 0.306 | 0.6940 | No | ||
| 17 | NNT | 540253 1170471 5550092 6760397 | 3348 | 0.233 | 0.6795 | No | ||
| 18 | TIMP3 | 1450504 1980270 | 3668 | 0.192 | 0.6684 | No | ||
| 19 | ATF3 | 1940546 | 3822 | 0.173 | 0.6657 | No | ||
| 20 | HMMR | 5720315 6380168 | 3996 | 0.159 | 0.6615 | No | ||
| 21 | KLF2 | 6860270 | 4615 | 0.113 | 0.6318 | No | ||
| 22 | CTGF | 4540577 | 4714 | 0.107 | 0.6299 | No | ||
| 23 | NUMB | 2450735 3800253 6350040 | 5296 | 0.081 | 0.6012 | No | ||
| 24 | SERPINB5 | 6940050 | 6357 | 0.050 | 0.5457 | No | ||
| 25 | IRF6 | 840241 2640139 4050373 6840471 | 6715 | 0.042 | 0.5278 | No | ||
| 26 | PKP1 | 1500433 | 8202 | 0.016 | 0.4484 | No | ||
| 27 | F3 | 2940180 | 8715 | 0.009 | 0.4211 | No | ||
| 28 | RARA | 4050161 | 9286 | 0.001 | 0.3904 | No | ||
| 29 | TACSTD1 | 3780025 | 9722 | -0.005 | 0.3672 | No | ||
| 30 | KITLG | 2120047 6220300 | 10593 | -0.018 | 0.3209 | No | ||
| 31 | FOSB | 1940142 | 10818 | -0.021 | 0.3095 | No | ||
| 32 | AMD1 | 6290128 | 11467 | -0.032 | 0.2757 | No | ||
| 33 | ARHGEF1 | 610347 4850603 6420672 | 13195 | -0.077 | 0.1852 | No | ||
| 34 | FBP2 | 1580193 | 13867 | -0.109 | 0.1525 | No | ||
| 35 | THBS1 | 4560494 430288 | 13959 | -0.114 | 0.1512 | No | ||
| 36 | TGFB3 | 1070041 | 16150 | -0.396 | 0.0459 | No | ||
| 37 | EGR1 | 4610347 | 16691 | -0.558 | 0.0346 | No | ||
| 38 | ATP1A1 | 5670451 | 16905 | -0.623 | 0.0430 | No | ||
| 39 | MYH9 | 3120091 4850292 | 16916 | -0.628 | 0.0624 | No | ||
| 40 | STAT5A | 2680458 | 17538 | -0.913 | 0.0580 | No |

