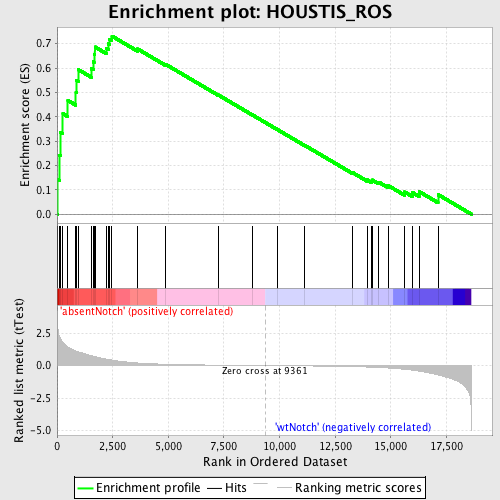
Profile of the Running ES Score & Positions of GeneSet Members on the Rank Ordered List
| Dataset | Set_03_absentNotch_versus_wtNotch.phenotype_absentNotch_versus_wtNotch.cls #absentNotch_versus_wtNotch.phenotype_absentNotch_versus_wtNotch.cls #absentNotch_versus_wtNotch_repos |
| Phenotype | phenotype_absentNotch_versus_wtNotch.cls#absentNotch_versus_wtNotch_repos |
| Upregulated in class | absentNotch |
| GeneSet | HOUSTIS_ROS |
| Enrichment Score (ES) | 0.73116356 |
| Normalized Enrichment Score (NES) | 1.7332796 |
| Nominal p-value | 0.0 |
| FDR q-value | 0.09089634 |
| FWER p-Value | 0.353 |
| PROBE | DESCRIPTION (from dataset) | GENE SYMBOL | GENE_TITLE | RANK IN GENE LIST | RANK METRIC SCORE | RUNNING ES | CORE ENRICHMENT | |
|---|---|---|---|---|---|---|---|---|
| 1 | SDC4 | 6370411 | 26 | 3.068 | 0.1416 | Yes | ||
| 2 | PRDX2 | 6760095 4010619 5340577 | 108 | 2.230 | 0.2411 | Yes | ||
| 3 | HMOX1 | 1740687 | 142 | 2.093 | 0.3369 | Yes | ||
| 4 | GPX1 | 4150093 | 262 | 1.759 | 0.4125 | Yes | ||
| 5 | PRDX1 | 5720253 | 486 | 1.423 | 0.4668 | Yes | ||
| 6 | CYP1B1 | 4760735 | 848 | 1.118 | 0.4994 | Yes | ||
| 7 | GCLM | 4230270 | 876 | 1.098 | 0.5491 | Yes | ||
| 8 | GLRX2 | 940433 | 960 | 1.041 | 0.5932 | Yes | ||
| 9 | PRDX4 | 3800039 | 1540 | 0.758 | 0.5973 | Yes | ||
| 10 | PRDX3 | 1690035 | 1625 | 0.717 | 0.6262 | Yes | ||
| 11 | MT1A | 4850164 | 1664 | 0.699 | 0.6567 | Yes | ||
| 12 | HP | 2940551 6350068 | 1703 | 0.685 | 0.6866 | Yes | ||
| 13 | TXN2 | 2030402 | 2224 | 0.493 | 0.6816 | Yes | ||
| 14 | FTL1 | 5670594 | 2300 | 0.470 | 0.6995 | Yes | ||
| 15 | HMOX2 | 6100193 | 2357 | 0.450 | 0.7175 | Yes | ||
| 16 | MT2A | 6860286 | 2466 | 0.419 | 0.7312 | Yes | ||
| 17 | TXNRD1 | 6590446 | 3617 | 0.198 | 0.6785 | No | ||
| 18 | HPXN | 3440114 | 4879 | 0.099 | 0.6153 | No | ||
| 19 | CP | 2570484 | 7243 | 0.031 | 0.4896 | No | ||
| 20 | GPX5 | 4200397 5690739 | 8777 | 0.008 | 0.4075 | No | ||
| 21 | PRDX6 | 4920397 6380601 | 9885 | -0.007 | 0.3482 | No | ||
| 22 | FTH1 | 3830154 | 11126 | -0.026 | 0.2827 | No | ||
| 23 | GPX2 | 6940619 | 13290 | -0.081 | 0.1701 | No | ||
| 24 | TXN1 | 1850181 2260041 | 13936 | -0.113 | 0.1407 | No | ||
| 25 | SOD3 | 1410484 | 14145 | -0.125 | 0.1353 | No | ||
| 26 | GPX3 | 1340450 | 14161 | -0.126 | 0.1404 | No | ||
| 27 | CAT | 4280152 | 14463 | -0.148 | 0.1310 | No | ||
| 28 | XDH | 6840446 | 14884 | -0.186 | 0.1171 | No | ||
| 29 | GPX4 | 5080433 | 15617 | -0.288 | 0.0911 | No | ||
| 30 | SOD1 | 5890070 | 15974 | -0.356 | 0.0886 | No | ||
| 31 | TXNRD2 | 2510398 3780451 | 16272 | -0.431 | 0.0927 | No | ||
| 32 | SOD2 | 1410053 | 17123 | -0.717 | 0.0803 | No |

