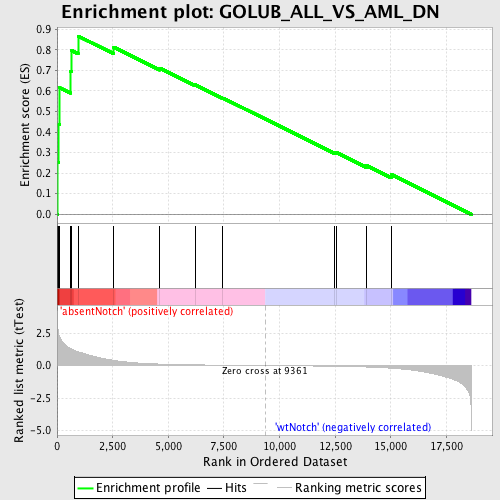
Profile of the Running ES Score & Positions of GeneSet Members on the Rank Ordered List
| Dataset | Set_03_absentNotch_versus_wtNotch.phenotype_absentNotch_versus_wtNotch.cls #absentNotch_versus_wtNotch.phenotype_absentNotch_versus_wtNotch.cls #absentNotch_versus_wtNotch_repos |
| Phenotype | phenotype_absentNotch_versus_wtNotch.cls#absentNotch_versus_wtNotch_repos |
| Upregulated in class | absentNotch |
| GeneSet | GOLUB_ALL_VS_AML_DN |
| Enrichment Score (ES) | 0.8670511 |
| Normalized Enrichment Score (NES) | 1.7213501 |
| Nominal p-value | 0.0 |
| FDR q-value | 0.10273927 |
| FWER p-Value | 0.443 |
| PROBE | DESCRIPTION (from dataset) | GENE SYMBOL | GENE_TITLE | RANK IN GENE LIST | RANK METRIC SCORE | RUNNING ES | CORE ENRICHMENT | |
|---|---|---|---|---|---|---|---|---|
| 1 | LEPROT | 5130450 | 20 | 3.124 | 0.2528 | Yes | ||
| 2 | CST3 | 7050452 | 81 | 2.325 | 0.4385 | Yes | ||
| 3 | FAH | 5390195 | 119 | 2.200 | 0.6152 | Yes | ||
| 4 | NFKBIA | 1570152 | 592 | 1.317 | 0.6969 | Yes | ||
| 5 | CTSD | 1070195 | 635 | 1.275 | 0.7982 | Yes | ||
| 6 | MCL1 | 1660672 | 945 | 1.051 | 0.8671 | Yes | ||
| 7 | SQSTM1 | 6550056 | 2548 | 0.399 | 0.8134 | No | ||
| 8 | PPIF | 1740059 | 4621 | 0.113 | 0.7111 | No | ||
| 9 | CD33 | 3990735 | 6208 | 0.053 | 0.6302 | No | ||
| 10 | CFD | 2320736 | 7455 | 0.028 | 0.5655 | No | ||
| 11 | ZYX | 4730068 | 12476 | -0.055 | 0.3001 | No | ||
| 12 | LYN | 6040600 | 12550 | -0.056 | 0.3008 | No | ||
| 13 | HOXA9 | 610494 4730040 5130601 | 13898 | -0.111 | 0.2374 | No | ||
| 14 | ATP6V0C | 1780609 | 15016 | -0.199 | 0.1935 | No |

