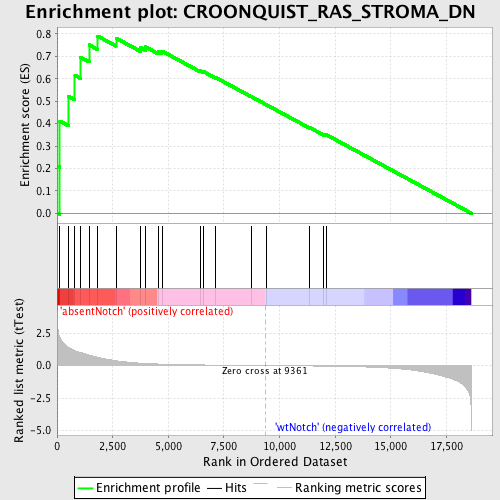
Profile of the Running ES Score & Positions of GeneSet Members on the Rank Ordered List
| Dataset | Set_03_absentNotch_versus_wtNotch.phenotype_absentNotch_versus_wtNotch.cls #absentNotch_versus_wtNotch.phenotype_absentNotch_versus_wtNotch.cls #absentNotch_versus_wtNotch_repos |
| Phenotype | phenotype_absentNotch_versus_wtNotch.cls#absentNotch_versus_wtNotch_repos |
| Upregulated in class | absentNotch |
| GeneSet | CROONQUIST_RAS_STROMA_DN |
| Enrichment Score (ES) | 0.790239 |
| Normalized Enrichment Score (NES) | 1.7053975 |
| Nominal p-value | 0.0 |
| FDR q-value | 0.101613715 |
| FWER p-Value | 0.565 |
| PROBE | DESCRIPTION (from dataset) | GENE SYMBOL | GENE_TITLE | RANK IN GENE LIST | RANK METRIC SCORE | RUNNING ES | CORE ENRICHMENT | |
|---|---|---|---|---|---|---|---|---|
| 1 | FSCN1 | 3450463 | 99 | 2.255 | 0.2070 | Yes | ||
| 2 | DUSP1 | 6860121 | 125 | 2.179 | 0.4108 | Yes | ||
| 3 | TGFBI | 2060446 6900112 | 505 | 1.397 | 0.5220 | Yes | ||
| 4 | GJA1 | 5220731 | 803 | 1.160 | 0.6152 | Yes | ||
| 5 | IGFBP7 | 520411 3060110 5290152 | 1046 | 1.001 | 0.6965 | Yes | ||
| 6 | NR4A2 | 60273 | 1442 | 0.804 | 0.7509 | Yes | ||
| 7 | TPM2 | 520735 3870390 | 1823 | 0.634 | 0.7902 | Yes | ||
| 8 | COL1A2 | 380364 | 2647 | 0.373 | 0.7811 | No | ||
| 9 | NUPR1 | 1990524 | 3762 | 0.181 | 0.7382 | No | ||
| 10 | FOS | 1850315 | 3972 | 0.161 | 0.7421 | No | ||
| 11 | CD81 | 5270093 | 4554 | 0.117 | 0.7219 | No | ||
| 12 | CTGF | 4540577 | 4714 | 0.107 | 0.7234 | No | ||
| 13 | TMSB4X | 6620114 | 6439 | 0.048 | 0.6352 | No | ||
| 14 | POSTN | 450411 6040451 | 6595 | 0.044 | 0.6310 | No | ||
| 15 | ACTA2 | 60008 1230082 | 7116 | 0.034 | 0.6062 | No | ||
| 16 | IL6 | 380133 | 8738 | 0.009 | 0.5199 | No | ||
| 17 | IGFBP3 | 2370500 | 9391 | -0.000 | 0.4849 | No | ||
| 18 | SPARC | 1690086 | 11350 | -0.030 | 0.3824 | No | ||
| 19 | COL6A3 | 2640717 4070064 5390717 | 11989 | -0.043 | 0.3521 | No | ||
| 20 | SULF1 | 430575 | 12090 | -0.045 | 0.3509 | No |

