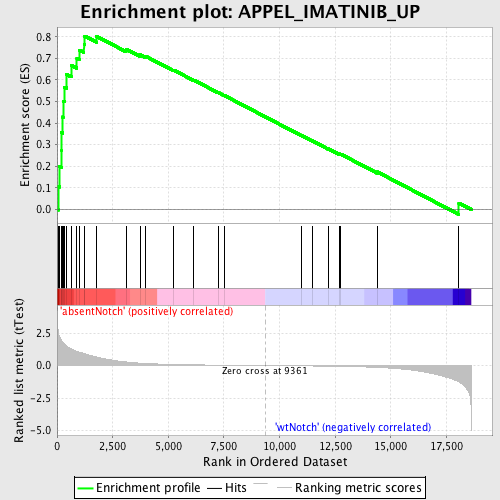
Profile of the Running ES Score & Positions of GeneSet Members on the Rank Ordered List
| Dataset | Set_03_absentNotch_versus_wtNotch.phenotype_absentNotch_versus_wtNotch.cls #absentNotch_versus_wtNotch.phenotype_absentNotch_versus_wtNotch.cls #absentNotch_versus_wtNotch_repos |
| Phenotype | phenotype_absentNotch_versus_wtNotch.cls#absentNotch_versus_wtNotch_repos |
| Upregulated in class | absentNotch |
| GeneSet | APPEL_IMATINIB_UP |
| Enrichment Score (ES) | 0.8031262 |
| Normalized Enrichment Score (NES) | 1.8545136 |
| Nominal p-value | 0.0 |
| FDR q-value | 0.009582604 |
| FWER p-Value | 0.015 |
| PROBE | DESCRIPTION (from dataset) | GENE SYMBOL | GENE_TITLE | RANK IN GENE LIST | RANK METRIC SCORE | RUNNING ES | CORE ENRICHMENT | |
|---|---|---|---|---|---|---|---|---|
| 1 | CTSH | 60524 | 48 | 2.594 | 0.1071 | Yes | ||
| 2 | APOE | 4200671 | 109 | 2.229 | 0.1982 | Yes | ||
| 3 | HEXA | 2630358 | 196 | 1.931 | 0.2752 | Yes | ||
| 4 | LAMP1 | 2470524 | 203 | 1.920 | 0.3560 | Yes | ||
| 5 | NEU1 | 380546 | 256 | 1.780 | 0.4285 | Yes | ||
| 6 | APOC1 | 5900066 6220408 | 271 | 1.736 | 0.5012 | Yes | ||
| 7 | CTSZ | 1500687 1690364 | 328 | 1.634 | 0.5672 | Yes | ||
| 8 | CD68 | 6350450 | 428 | 1.506 | 0.6256 | Yes | ||
| 9 | CTSD | 1070195 | 635 | 1.275 | 0.6684 | Yes | ||
| 10 | CTSB | 1400524 2360064 | 889 | 1.092 | 0.7010 | Yes | ||
| 11 | PLSCR1 | 2650301 | 992 | 1.022 | 0.7387 | Yes | ||
| 12 | LAMP2 | 1230402 1980373 | 1208 | 0.932 | 0.7666 | Yes | ||
| 13 | ASAH1 | 510152 1340484 1740707 | 1241 | 0.905 | 0.8031 | Yes | ||
| 14 | GNS | 3120458 | 1777 | 0.652 | 0.8019 | No | ||
| 15 | PPARG | 1990168 2680603 6130632 | 3098 | 0.276 | 0.7426 | No | ||
| 16 | GM2A | 430095 | 3728 | 0.185 | 0.7166 | No | ||
| 17 | RARRES1 | 770139 5860390 | 3985 | 0.160 | 0.7096 | No | ||
| 18 | OSBPL3 | 3170164 4210196 | 5235 | 0.084 | 0.6459 | No | ||
| 19 | PLD1 | 2450537 | 6139 | 0.055 | 0.5996 | No | ||
| 20 | C5AR1 | 4540402 | 7252 | 0.031 | 0.5412 | No | ||
| 21 | HEXB | 5860692 | 7524 | 0.027 | 0.5277 | No | ||
| 22 | CD163 | 2480315 | 10982 | -0.024 | 0.3428 | No | ||
| 23 | GBA | 2640301 | 11471 | -0.032 | 0.3179 | No | ||
| 24 | ENG | 4280270 | 12177 | -0.047 | 0.2819 | No | ||
| 25 | MSR1 | 940538 | 12681 | -0.060 | 0.2574 | No | ||
| 26 | FUCA1 | 610075 | 12748 | -0.062 | 0.2564 | No | ||
| 27 | APOD | 4920441 | 14391 | -0.142 | 0.1741 | No | ||
| 28 | ACP5 | 2230717 | 18060 | -1.257 | 0.0299 | No |

