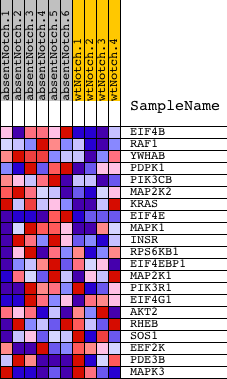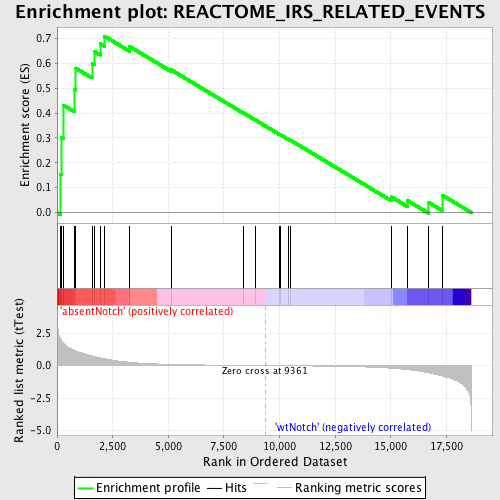
Profile of the Running ES Score & Positions of GeneSet Members on the Rank Ordered List
| Dataset | Set_03_absentNotch_versus_wtNotch.phenotype_absentNotch_versus_wtNotch.cls #absentNotch_versus_wtNotch.phenotype_absentNotch_versus_wtNotch.cls #absentNotch_versus_wtNotch_repos |
| Phenotype | phenotype_absentNotch_versus_wtNotch.cls#absentNotch_versus_wtNotch_repos |
| Upregulated in class | absentNotch |
| GeneSet | REACTOME_IRS_RELATED_EVENTS |
| Enrichment Score (ES) | 0.70903724 |
| Normalized Enrichment Score (NES) | 1.5683979 |
| Nominal p-value | 0.015503876 |
| FDR q-value | 0.7693286 |
| FWER p-Value | 0.977 |
| PROBE | DESCRIPTION (from dataset) | GENE SYMBOL | GENE_TITLE | RANK IN GENE LIST | RANK METRIC SCORE | RUNNING ES | CORE ENRICHMENT | |
|---|---|---|---|---|---|---|---|---|
| 1 | EIF4B | 5390563 5270577 | 143 | 2.090 | 0.1544 | Yes | ||
| 2 | RAF1 | 1770600 | 188 | 1.946 | 0.3029 | Yes | ||
| 3 | YWHAB | 1740176 | 277 | 1.729 | 0.4322 | Yes | ||
| 4 | PDPK1 | 6650168 | 798 | 1.163 | 0.4945 | Yes | ||
| 5 | PIK3CB | 3800600 | 837 | 1.134 | 0.5804 | Yes | ||
| 6 | MAP2K2 | 4590601 | 1571 | 0.745 | 0.5987 | Yes | ||
| 7 | KRAS | 2060170 | 1666 | 0.698 | 0.6478 | Yes | ||
| 8 | EIF4E | 1580403 70133 6380215 | 1940 | 0.587 | 0.6787 | Yes | ||
| 9 | MAPK1 | 3190193 6200253 | 2128 | 0.522 | 0.7090 | Yes | ||
| 10 | INSR | 1190504 | 3250 | 0.247 | 0.6679 | No | ||
| 11 | RPS6KB1 | 1450427 5080110 6200563 | 5133 | 0.088 | 0.5735 | No | ||
| 12 | EIF4EBP1 | 60132 5720148 | 8355 | 0.014 | 0.4014 | No | ||
| 13 | MAP2K1 | 840739 | 8932 | 0.006 | 0.3708 | No | ||
| 14 | PIK3R1 | 4730671 | 9986 | -0.008 | 0.3149 | No | ||
| 15 | EIF4G1 | 4070446 | 10031 | -0.009 | 0.3132 | No | ||
| 16 | AKT2 | 3850541 3870519 | 10409 | -0.015 | 0.2941 | No | ||
| 17 | RHEB | 6760441 | 10489 | -0.016 | 0.2911 | No | ||
| 18 | SOS1 | 7050338 | 15025 | -0.201 | 0.0628 | No | ||
| 19 | EEF2K | 3800673 | 15760 | -0.313 | 0.0476 | No | ||
| 20 | PDE3B | 2030563 | 16711 | -0.562 | 0.0401 | No | ||
| 21 | MAPK3 | 580161 4780035 | 17337 | -0.803 | 0.0688 | No |