Profile of the Running ES Score & Positions of GeneSet Members on the Rank Ordered List
| Dataset | Set_03_absentNotch_versus_truncNotch.phenotype_absentNotch_versus_truncNotch.cls #absentNotch_versus_truncNotch.phenotype_absentNotch_versus_truncNotch.cls #absentNotch_versus_truncNotch_repos |
| Phenotype | phenotype_absentNotch_versus_truncNotch.cls#absentNotch_versus_truncNotch_repos |
| Upregulated in class | absentNotch |
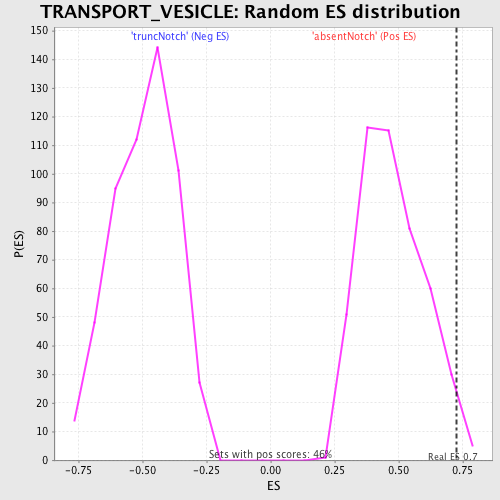
| GeneSet | TRANSPORT_VESICLE |
| Enrichment Score (ES) | 0.72452515 |
| Normalized Enrichment Score (NES) | 1.5262417 |
| Nominal p-value | 0.019607844 |
| FDR q-value | 0.6043934 |
| FWER p-Value | 1.0 |
| PROBE | DESCRIPTION (from dataset) | GENE SYMBOL | GENE_TITLE | RANK IN GENE LIST | RANK METRIC SCORE | RUNNING ES | CORE ENRICHMENT | |
|---|---|---|---|---|---|---|---|---|
| 1 | RAB14 | 6860139 | 21 | 5.314 | 0.2130 | Yes | ||
| 2 | AP3S1 | 5570044 | 48 | 4.776 | 0.4041 | Yes | ||
| 3 | PLEKHF2 | 1850075 3840092 | 90 | 4.231 | 0.5724 | Yes | ||
| 4 | IGF2R | 1570402 | 544 | 2.593 | 0.6525 | Yes | ||
| 5 | AP1GBP1 | 2510372 | 1382 | 1.466 | 0.6666 | Yes | ||
| 6 | TGOLN2 | 4920433 | 1393 | 1.452 | 0.7245 | Yes | ||
| 7 | CAV2 | 5130286 5130563 | 5292 | 0.063 | 0.5175 | No | ||
| 8 | GOPC | 6620400 | 5371 | 0.060 | 0.5157 | No | ||
| 9 | PAMCI | 2320687 | 7683 | 0.004 | 0.3916 | No | ||
| 10 | ATP7A | 6550168 | 8843 | -0.015 | 0.3299 | No | ||
| 11 | NRSN1 | 6290528 | 9875 | -0.034 | 0.2759 | No | ||
| 12 | SSPN | 4670091 | 11247 | -0.066 | 0.2048 | No | ||
| 13 | BGN | 4730176 | 14013 | -0.252 | 0.0663 | No | ||
| 14 | SPG21 | 2060619 | 14919 | -0.418 | 0.0345 | No | ||
| 15 | FURIN | 4120168 | 15241 | -0.514 | 0.0379 | No | ||
| 16 | AP1G2 | 780458 2690068 | 16217 | -0.969 | 0.0246 | No | ||
| 17 | SYT13 | 5910110 | 16417 | -1.075 | 0.0572 | No | ||
| 18 | AP1S1 | 2030471 4570520 6900603 | 17035 | -1.514 | 0.0850 | No |