Profile of the Running ES Score & Positions of GeneSet Members on the Rank Ordered List
| Dataset | Set_03_absentNotch_versus_truncNotch.phenotype_absentNotch_versus_truncNotch.cls #absentNotch_versus_truncNotch.phenotype_absentNotch_versus_truncNotch.cls #absentNotch_versus_truncNotch_repos |
| Phenotype | phenotype_absentNotch_versus_truncNotch.cls#absentNotch_versus_truncNotch_repos |
| Upregulated in class | absentNotch |
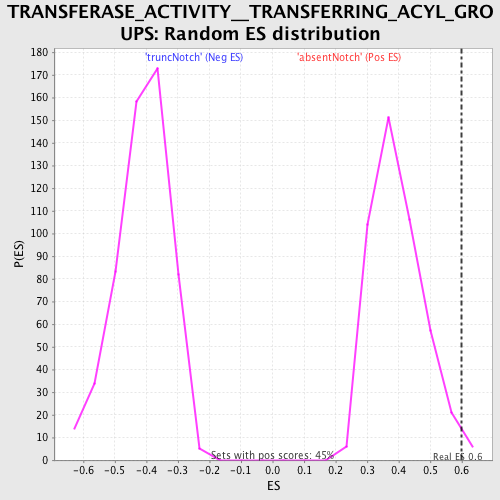
| GeneSet | TRANSFERASE_ACTIVITY__TRANSFERRING_ACYL_GROUPS |
| Enrichment Score (ES) | 0.5990012 |
| Normalized Enrichment Score (NES) | 1.5149473 |
| Nominal p-value | 0.01330377 |
| FDR q-value | 0.5803574 |
| FWER p-Value | 1.0 |
| PROBE | DESCRIPTION (from dataset) | GENE SYMBOL | GENE_TITLE | RANK IN GENE LIST | RANK METRIC SCORE | RUNNING ES | CORE ENRICHMENT | |
|---|---|---|---|---|---|---|---|---|
| 1 | EDF1 | 1660035 2640161 | 10 | 6.032 | 0.1273 | Yes | ||
| 2 | ACLY | 1740609 | 64 | 4.517 | 0.2202 | Yes | ||
| 3 | HAT1 | 3710082 | 132 | 3.945 | 0.3002 | Yes | ||
| 4 | SOAT1 | 1190019 | 288 | 3.267 | 0.3610 | Yes | ||
| 5 | SMARCE1 | 4920465 4390398 | 335 | 3.093 | 0.4241 | Yes | ||
| 6 | CREBBP | 5690035 7040050 | 535 | 2.625 | 0.4690 | Yes | ||
| 7 | HMGCS1 | 6620452 | 551 | 2.584 | 0.5230 | Yes | ||
| 8 | GTF3C4 | 1940750 4730114 | 1200 | 1.664 | 0.5233 | Yes | ||
| 9 | DGAT2 | 5130685 | 1572 | 1.266 | 0.5302 | Yes | ||
| 10 | SPTLC1 | 4070561 610156 | 2038 | 0.946 | 0.5252 | Yes | ||
| 11 | PNPLA3 | 5050551 | 2071 | 0.923 | 0.5431 | Yes | ||
| 12 | SAT1 | 4570463 | 2079 | 0.916 | 0.5621 | Yes | ||
| 13 | BRCA2 | 4280372 | 2264 | 0.810 | 0.5693 | Yes | ||
| 14 | NCOA3 | 4540195 | 2284 | 0.802 | 0.5853 | Yes | ||
| 15 | CS | 5080600 | 2538 | 0.656 | 0.5856 | Yes | ||
| 16 | SPTLC2 | 6840324 520017 | 2555 | 0.652 | 0.5986 | Yes | ||
| 17 | TGM2 | 5360452 | 2766 | 0.555 | 0.5990 | Yes | ||
| 18 | HADHB | 60064 2690670 | 3063 | 0.436 | 0.5923 | No | ||
| 19 | ATE1 | 290491 6940722 | 3151 | 0.407 | 0.5962 | No | ||
| 20 | GGTLA1 | 3140273 4920168 | 4507 | 0.112 | 0.5256 | No | ||
| 21 | ACSL3 | 3140195 | 5101 | 0.072 | 0.4952 | No | ||
| 22 | ACAT1 | 3170600 630438 | 5106 | 0.071 | 0.4965 | No | ||
| 23 | NAT2 | 6760195 | 5271 | 0.064 | 0.4890 | No | ||
| 24 | MYST4 | 1400563 2570687 3360458 6840402 | 5336 | 0.061 | 0.4869 | No | ||
| 25 | TGM5 | 4060333 6510079 | 7815 | 0.002 | 0.3535 | No | ||
| 26 | CROT | 2260433 | 8333 | -0.007 | 0.3258 | No | ||
| 27 | AANAT | 610609 | 9574 | -0.028 | 0.2596 | No | ||
| 28 | HADHA | 3190041 | 9974 | -0.036 | 0.2389 | No | ||
| 29 | CPT1A | 6350093 | 10027 | -0.038 | 0.2369 | No | ||
| 30 | ELP4 | 1230576 | 10132 | -0.040 | 0.2321 | No | ||
| 31 | TGM1 | 1090500 | 10264 | -0.042 | 0.2260 | No | ||
| 32 | NAT1 | 2480348 | 10488 | -0.047 | 0.2150 | No | ||
| 33 | LASS1 | 3440746 6110152 | 10556 | -0.049 | 0.2124 | No | ||
| 34 | TGM3 | 840576 | 10886 | -0.056 | 0.1959 | No | ||
| 35 | LRAT | 5130603 | 12799 | -0.136 | 0.0958 | No | ||
| 36 | MYST2 | 4540494 | 13030 | -0.153 | 0.0866 | No | ||
| 37 | GLYAT | 6200239 | 13274 | -0.171 | 0.0772 | No | ||
| 38 | CPT1B | 940086 2690433 | 13910 | -0.240 | 0.0481 | No | ||
| 39 | TAF5 | 3450288 5890193 6860435 | 14025 | -0.254 | 0.0473 | No | ||
| 40 | NARG1 | 5910563 6350095 | 14518 | -0.334 | 0.0279 | No | ||
| 41 | SOAT2 | 1230324 3610603 | 14806 | -0.393 | 0.0208 | No | ||
| 42 | ALAS2 | 6550176 | 15065 | -0.458 | 0.0166 | No | ||
| 43 | LASS5 | 380215 | 15535 | -0.616 | 0.0044 | No | ||
| 44 | MYST1 | 2190397 | 16420 | -1.076 | -0.0204 | No | ||
| 45 | AGPAT2 | 6110592 | 16890 | -1.433 | -0.0153 | No | ||
| 46 | GNPAT | 5360377 | 17019 | -1.507 | 0.0097 | No | ||
| 47 | MYST3 | 5270500 | 17220 | -1.648 | 0.0339 | No | ||
| 48 | DGAT1 | 1850538 | 17546 | -1.947 | 0.0576 | No |