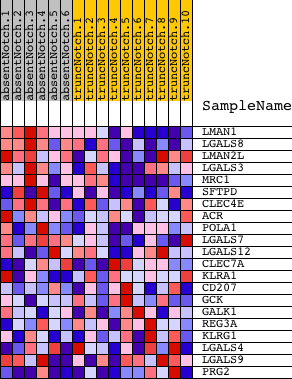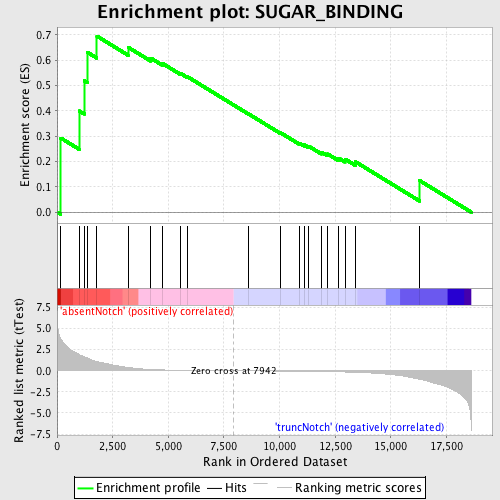
Profile of the Running ES Score & Positions of GeneSet Members on the Rank Ordered List
| Dataset | Set_03_absentNotch_versus_truncNotch.phenotype_absentNotch_versus_truncNotch.cls #absentNotch_versus_truncNotch.phenotype_absentNotch_versus_truncNotch.cls #absentNotch_versus_truncNotch_repos |
| Phenotype | phenotype_absentNotch_versus_truncNotch.cls#absentNotch_versus_truncNotch_repos |
| Upregulated in class | absentNotch |
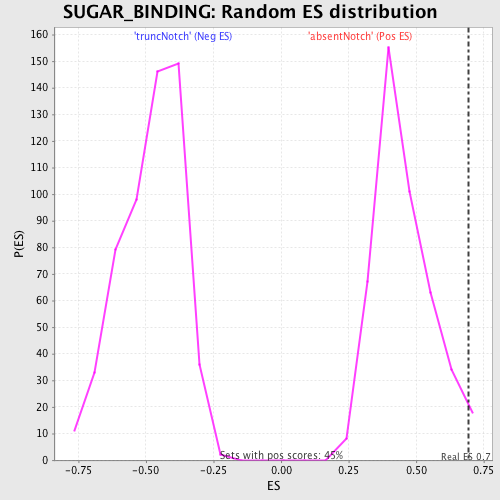
| GeneSet | SUGAR_BINDING |
| Enrichment Score (ES) | 0.6945611 |
| Normalized Enrichment Score (NES) | 1.5350887 |
| Nominal p-value | 0.033632286 |
| FDR q-value | 0.66161233 |
| FWER p-Value | 1.0 |
| PROBE | DESCRIPTION (from dataset) | GENE SYMBOL | GENE_TITLE | RANK IN GENE LIST | RANK METRIC SCORE | RUNNING ES | CORE ENRICHMENT | |
|---|---|---|---|---|---|---|---|---|
| 1 | LMAN1 | 3420068 | 167 | 3.768 | 0.2924 | Yes | ||
| 2 | LGALS8 | 6840059 | 994 | 1.893 | 0.3995 | Yes | ||
| 3 | LMAN2L | 50079 6590100 6650338 | 1225 | 1.644 | 0.5186 | Yes | ||
| 4 | LGALS3 | 2120239 | 1355 | 1.492 | 0.6311 | Yes | ||
| 5 | MRC1 | 730097 | 1789 | 1.085 | 0.6946 | Yes | ||
| 6 | SFTPD | 6510181 | 3196 | 0.393 | 0.6504 | No | ||
| 7 | CLEC4E | 2940102 6550735 | 4207 | 0.146 | 0.6078 | No | ||
| 8 | ACR | 2940017 3060050 | 4740 | 0.094 | 0.5867 | No | ||
| 9 | POLA1 | 4760541 | 5556 | 0.053 | 0.5471 | No | ||
| 10 | LGALS7 | 630148 | 5845 | 0.044 | 0.5351 | No | ||
| 11 | LGALS12 | 3940242 | 8610 | -0.011 | 0.3874 | No | ||
| 12 | CLEC7A | 1990121 3450736 3800064 4610035 | 10049 | -0.038 | 0.3131 | No | ||
| 13 | KLRA1 | 2370008 | 10882 | -0.056 | 0.2729 | No | ||
| 14 | CD207 | 1990139 | 11109 | -0.062 | 0.2656 | No | ||
| 15 | GCK | 2370273 | 11320 | -0.069 | 0.2598 | No | ||
| 16 | GALK1 | 840162 | 11886 | -0.088 | 0.2365 | No | ||
| 17 | REG3A | 4220202 | 12159 | -0.099 | 0.2298 | No | ||
| 18 | KLRG1 | 2360133 | 12655 | -0.126 | 0.2132 | No | ||
| 19 | LGALS4 | 2260215 3390338 | 12941 | -0.146 | 0.2096 | No | ||
| 20 | LGALS9 | 1230079 2640181 2970398 | 13407 | -0.182 | 0.1992 | No | ||
| 21 | PRG2 | 4070176 | 16297 | -1.011 | 0.1247 | No |