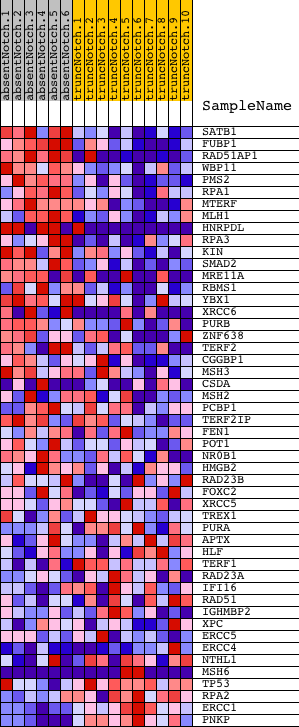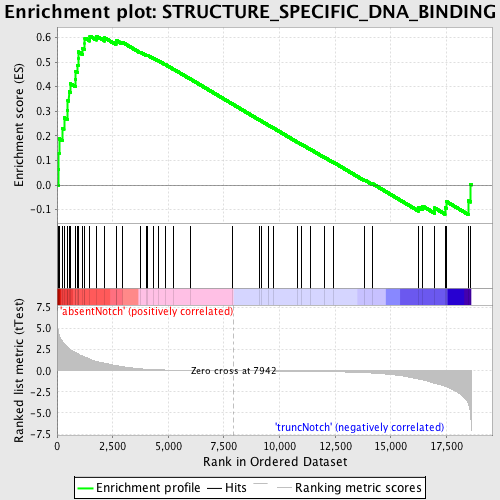
Profile of the Running ES Score & Positions of GeneSet Members on the Rank Ordered List
| Dataset | Set_03_absentNotch_versus_truncNotch.phenotype_absentNotch_versus_truncNotch.cls #absentNotch_versus_truncNotch.phenotype_absentNotch_versus_truncNotch.cls #absentNotch_versus_truncNotch_repos |
| Phenotype | phenotype_absentNotch_versus_truncNotch.cls#absentNotch_versus_truncNotch_repos |
| Upregulated in class | absentNotch |
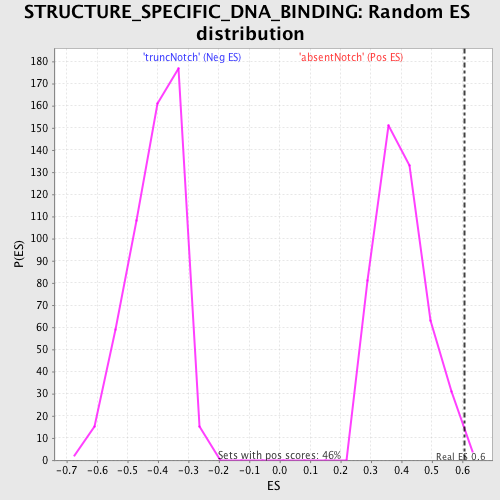
| GeneSet | STRUCTURE_SPECIFIC_DNA_BINDING |
| Enrichment Score (ES) | 0.6057828 |
| Normalized Enrichment Score (NES) | 1.519091 |
| Nominal p-value | 0.0064794817 |
| FDR q-value | 0.5845764 |
| FWER p-Value | 1.0 |
| PROBE | DESCRIPTION (from dataset) | GENE SYMBOL | GENE_TITLE | RANK IN GENE LIST | RANK METRIC SCORE | RUNNING ES | CORE ENRICHMENT | |
|---|---|---|---|---|---|---|---|---|
| 1 | SATB1 | 5670154 | 55 | 4.668 | 0.0648 | Yes | ||
| 2 | FUBP1 | 5390373 | 71 | 4.465 | 0.1288 | Yes | ||
| 3 | RAD51AP1 | 4050736 6370528 | 93 | 4.193 | 0.1885 | Yes | ||
| 4 | WBP11 | 6450725 | 244 | 3.441 | 0.2304 | Yes | ||
| 5 | PMS2 | 6760739 | 310 | 3.192 | 0.2733 | Yes | ||
| 6 | RPA1 | 360452 | 466 | 2.775 | 0.3052 | Yes | ||
| 7 | MTERF | 6650441 | 483 | 2.745 | 0.3442 | Yes | ||
| 8 | MLH1 | 6450168 | 534 | 2.626 | 0.3796 | Yes | ||
| 9 | HNRPDL | 1050102 1090181 5360471 | 603 | 2.480 | 0.4119 | Yes | ||
| 10 | RPA3 | 5700136 | 822 | 2.144 | 0.4313 | Yes | ||
| 11 | KIN | 6550014 | 837 | 2.124 | 0.4614 | Yes | ||
| 12 | SMAD2 | 4200592 | 912 | 2.023 | 0.4868 | Yes | ||
| 13 | MRE11A | 3850601 4670332 | 947 | 1.971 | 0.5136 | Yes | ||
| 14 | RBMS1 | 6400014 | 954 | 1.950 | 0.5415 | Yes | ||
| 15 | YBX1 | 1340039 4730500 | 1137 | 1.739 | 0.5570 | Yes | ||
| 16 | XRCC6 | 2850450 3870528 | 1246 | 1.614 | 0.5746 | Yes | ||
| 17 | PURB | 5360138 | 1249 | 1.611 | 0.5979 | Yes | ||
| 18 | ZNF638 | 6510112 | 1474 | 1.369 | 0.6057 | Yes | ||
| 19 | TERF2 | 3840044 | 1768 | 1.093 | 0.6058 | Yes | ||
| 20 | CGGBP1 | 4810053 | 2140 | 0.886 | 0.5987 | No | ||
| 21 | MSH3 | 6770575 | 2648 | 0.612 | 0.5802 | No | ||
| 22 | CSDA | 2470092 3060053 4780056 | 2655 | 0.610 | 0.5888 | No | ||
| 23 | MSH2 | 6180273 | 2927 | 0.488 | 0.5813 | No | ||
| 24 | PCBP1 | 1050088 | 3742 | 0.229 | 0.5408 | No | ||
| 25 | TERF2IP | 580010 870364 2190358 | 4032 | 0.172 | 0.5277 | No | ||
| 26 | FEN1 | 1770541 | 4062 | 0.166 | 0.5285 | No | ||
| 27 | POT1 | 5340184 | 4339 | 0.130 | 0.5156 | No | ||
| 28 | NR0B1 | 6510750 | 4542 | 0.109 | 0.5063 | No | ||
| 29 | HMGB2 | 2640603 | 4856 | 0.085 | 0.4907 | No | ||
| 30 | RAD23B | 2190671 | 5234 | 0.065 | 0.4713 | No | ||
| 31 | FOXC2 | 4150041 | 5974 | 0.040 | 0.4321 | No | ||
| 32 | XRCC5 | 7100286 | 7892 | 0.001 | 0.3288 | No | ||
| 33 | TREX1 | 3450040 7100692 | 9111 | -0.020 | 0.2635 | No | ||
| 34 | PURA | 3870156 | 9192 | -0.021 | 0.2595 | No | ||
| 35 | APTX | 3360041 4560167 | 9520 | -0.027 | 0.2423 | No | ||
| 36 | HLF | 2370113 | 9743 | -0.031 | 0.2308 | No | ||
| 37 | TERF1 | 2340113 | 10806 | -0.055 | 0.1744 | No | ||
| 38 | RAD23A | 670082 5270309 5360463 5550364 | 10978 | -0.058 | 0.1660 | No | ||
| 39 | IFI16 | 6520601 | 11411 | -0.071 | 0.1438 | No | ||
| 40 | RAD51 | 6110450 6980280 | 12021 | -0.093 | 0.1124 | No | ||
| 41 | IGHMBP2 | 2350292 | 12426 | -0.113 | 0.0922 | No | ||
| 42 | XPC | 6370193 | 13823 | -0.231 | 0.0204 | No | ||
| 43 | ERCC5 | 770025 4540692 | 14164 | -0.275 | 0.0061 | No | ||
| 44 | ERCC4 | 1570619 5720180 | 16247 | -0.987 | -0.0917 | No | ||
| 45 | NTHL1 | 4920148 | 16423 | -1.078 | -0.0855 | No | ||
| 46 | MSH6 | 4480064 6520093 | 16967 | -1.483 | -0.0932 | No | ||
| 47 | TP53 | 6130707 | 17437 | -1.852 | -0.0916 | No | ||
| 48 | RPA2 | 2760301 5420195 | 17509 | -1.909 | -0.0677 | No | ||
| 49 | ERCC1 | 3800010 4590132 4670397 | 18479 | -3.855 | -0.0639 | No | ||
| 50 | PNKP | 4610685 5720605 | 18578 | -4.908 | 0.0020 | No |