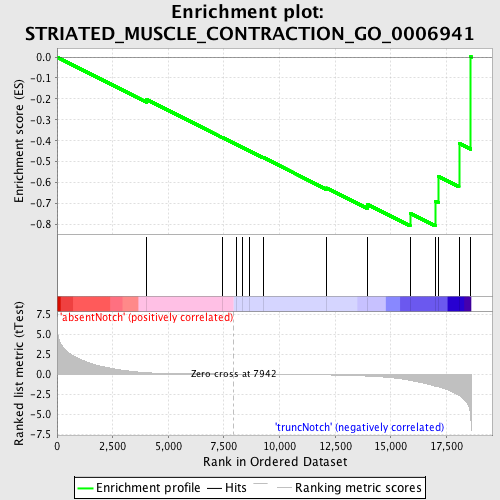
Profile of the Running ES Score & Positions of GeneSet Members on the Rank Ordered List
| Dataset | Set_03_absentNotch_versus_truncNotch.phenotype_absentNotch_versus_truncNotch.cls #absentNotch_versus_truncNotch.phenotype_absentNotch_versus_truncNotch.cls #absentNotch_versus_truncNotch_repos |
| Phenotype | phenotype_absentNotch_versus_truncNotch.cls#absentNotch_versus_truncNotch_repos |
| Upregulated in class | truncNotch |
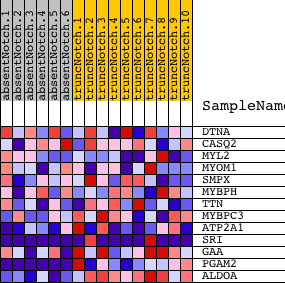
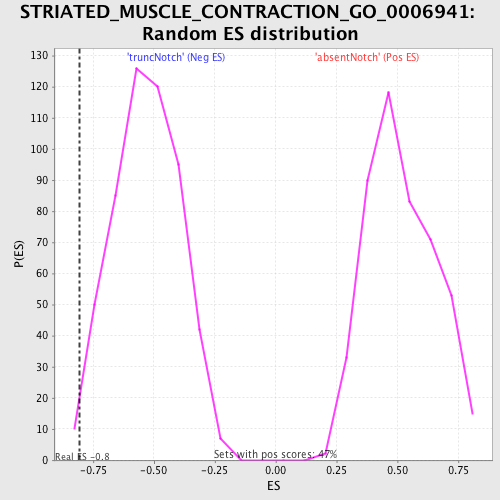
| GeneSet | STRIATED_MUSCLE_CONTRACTION_GO_0006941 |
| Enrichment Score (ES) | -0.8075173 |
| Normalized Enrichment Score (NES) | -1.5206411 |
| Nominal p-value | 0.009345794 |
| FDR q-value | 1.0 |
| FWER p-Value | 1.0 |
| PROBE | DESCRIPTION (from dataset) | GENE SYMBOL | GENE_TITLE | RANK IN GENE LIST | RANK METRIC SCORE | RUNNING ES | CORE ENRICHMENT | |
|---|---|---|---|---|---|---|---|---|
| 1 | DTNA | 1340600 1780731 2340278 2850132 | 4019 | 0.174 | -0.2023 | No | ||
| 2 | CASQ2 | 3170136 | 7430 | 0.009 | -0.3849 | No | ||
| 3 | MYL2 | 70471 | 8047 | -0.001 | -0.4179 | No | ||
| 4 | MYOM1 | 580091 | 8338 | -0.007 | -0.4330 | No | ||
| 5 | SMPX | 6590440 | 8658 | -0.012 | -0.4492 | No | ||
| 6 | MYBPH | 2190711 | 9266 | -0.022 | -0.4800 | No | ||
| 7 | TTN | 2320161 4670056 6550026 | 12124 | -0.098 | -0.6259 | No | ||
| 8 | MYBPC3 | 650390 | 13956 | -0.246 | -0.7049 | No | ||
| 9 | ATP2A1 | 110309 | 15867 | -0.778 | -0.7461 | Yes | ||
| 10 | SRI | 3390446 4850064 | 16996 | -1.497 | -0.6886 | Yes | ||
| 11 | GAA | 520035 | 17146 | -1.593 | -0.5708 | Yes | ||
| 12 | PGAM2 | 3610605 | 18065 | -2.637 | -0.4120 | Yes | ||
| 13 | ALDOA | 6290672 | 18596 | -5.593 | 0.0011 | Yes |