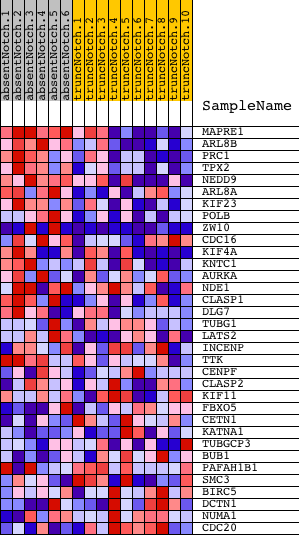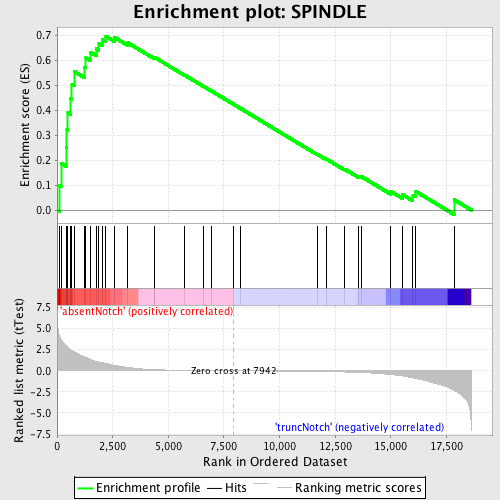
Profile of the Running ES Score & Positions of GeneSet Members on the Rank Ordered List
| Dataset | Set_03_absentNotch_versus_truncNotch.phenotype_absentNotch_versus_truncNotch.cls #absentNotch_versus_truncNotch.phenotype_absentNotch_versus_truncNotch.cls #absentNotch_versus_truncNotch_repos |
| Phenotype | phenotype_absentNotch_versus_truncNotch.cls#absentNotch_versus_truncNotch_repos |
| Upregulated in class | absentNotch |
| GeneSet | SPINDLE |
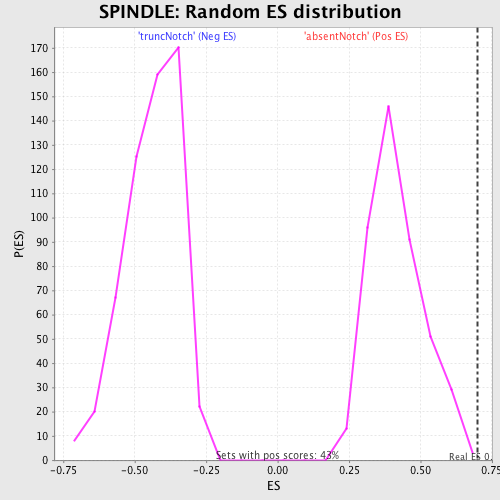
| Enrichment Score (ES) | 0.6979943 |
| Normalized Enrichment Score (NES) | 1.6717917 |
| Nominal p-value | 0.0023310024 |
| FDR q-value | 0.43016797 |
| FWER p-Value | 0.66 |
| PROBE | DESCRIPTION (from dataset) | GENE SYMBOL | GENE_TITLE | RANK IN GENE LIST | RANK METRIC SCORE | RUNNING ES | CORE ENRICHMENT | |
|---|---|---|---|---|---|---|---|---|
| 1 | MAPRE1 | 3290037 | 122 | 4.031 | 0.0971 | Yes | ||
| 2 | ARL8B | 3710368 | 191 | 3.654 | 0.1875 | Yes | ||
| 3 | PRC1 | 870092 5890204 | 406 | 2.929 | 0.2513 | Yes | ||
| 4 | TPX2 | 6420324 | 442 | 2.830 | 0.3222 | Yes | ||
| 5 | NEDD9 | 1740373 4230053 | 486 | 2.734 | 0.3903 | Yes | ||
| 6 | ARL8A | 4810162 | 599 | 2.485 | 0.4482 | Yes | ||
| 7 | KIF23 | 5570112 | 668 | 2.363 | 0.5053 | Yes | ||
| 8 | POLB | 1400333 | 784 | 2.195 | 0.5556 | Yes | ||
| 9 | ZW10 | 2900735 3520687 | 1231 | 1.639 | 0.5738 | Yes | ||
| 10 | CDC16 | 1940706 | 1295 | 1.556 | 0.6104 | Yes | ||
| 11 | KIF4A | 1410465 4760070 | 1519 | 1.317 | 0.6323 | Yes | ||
| 12 | KNTC1 | 430079 | 1764 | 1.098 | 0.6474 | Yes | ||
| 13 | AURKA | 780537 | 1880 | 1.026 | 0.6676 | Yes | ||
| 14 | NDE1 | 1580242 3830097 | 2028 | 0.950 | 0.6841 | Yes | ||
| 15 | CLASP1 | 6860279 | 2182 | 0.859 | 0.6980 | Yes | ||
| 16 | DLG7 | 3120041 | 2590 | 0.639 | 0.6925 | No | ||
| 17 | TUBG1 | 3140204 | 3184 | 0.397 | 0.6708 | No | ||
| 18 | LATS2 | 4480593 6020494 | 4384 | 0.125 | 0.6095 | No | ||
| 19 | INCENP | 520593 | 4390 | 0.124 | 0.6124 | No | ||
| 20 | TTK | 3800129 | 5743 | 0.047 | 0.5409 | No | ||
| 21 | CENPF | 5050088 | 6564 | 0.026 | 0.4974 | No | ||
| 22 | CLASP2 | 2510139 | 6949 | 0.018 | 0.4772 | No | ||
| 23 | KIF11 | 5390139 | 7948 | -0.000 | 0.4235 | No | ||
| 24 | FBXO5 | 2630551 | 8235 | -0.005 | 0.4082 | No | ||
| 25 | CETN1 | 6020056 | 11690 | -0.081 | 0.2244 | No | ||
| 26 | KATNA1 | 6290048 | 12122 | -0.098 | 0.2038 | No | ||
| 27 | TUBGCP3 | 4920563 | 12924 | -0.145 | 0.1644 | No | ||
| 28 | BUB1 | 5390270 | 13543 | -0.197 | 0.1362 | No | ||
| 29 | PAFAH1B1 | 4230333 6420121 6450066 | 13670 | -0.213 | 0.1349 | No | ||
| 30 | SMC3 | 870546 1400411 5700039 6450577 | 14995 | -0.436 | 0.0749 | No | ||
| 31 | BIRC5 | 110408 580014 1770632 | 15518 | -0.608 | 0.0624 | No | ||
| 32 | DCTN1 | 1450056 6590022 | 15995 | -0.842 | 0.0585 | No | ||
| 33 | NUMA1 | 6520576 | 16107 | -0.904 | 0.0757 | No | ||
| 34 | CDC20 | 3440017 3440044 6220088 | 17846 | -2.302 | 0.0414 | No |