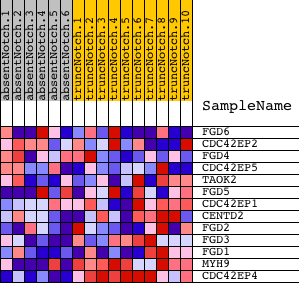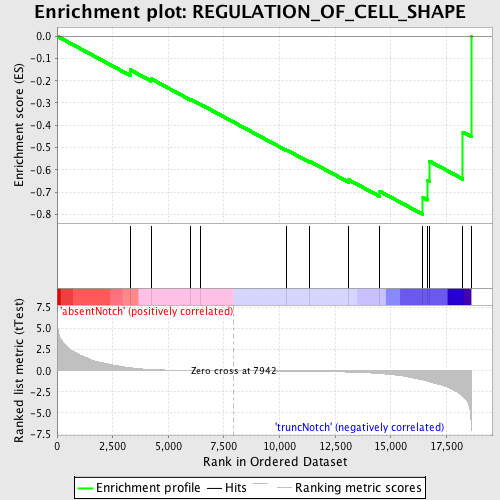
Profile of the Running ES Score & Positions of GeneSet Members on the Rank Ordered List
| Dataset | Set_03_absentNotch_versus_truncNotch.phenotype_absentNotch_versus_truncNotch.cls #absentNotch_versus_truncNotch.phenotype_absentNotch_versus_truncNotch.cls #absentNotch_versus_truncNotch_repos |
| Phenotype | phenotype_absentNotch_versus_truncNotch.cls#absentNotch_versus_truncNotch_repos |
| Upregulated in class | truncNotch |
| GeneSet | REGULATION_OF_CELL_SHAPE |
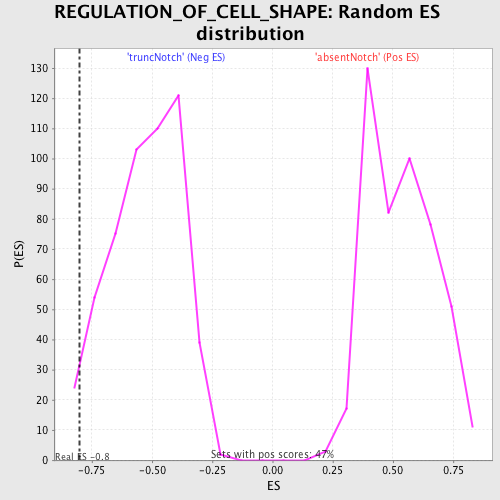
| Enrichment Score (ES) | -0.8006467 |
| Normalized Enrichment Score (NES) | -1.518393 |
| Nominal p-value | 0.028409092 |
| FDR q-value | 0.88254154 |
| FWER p-Value | 1.0 |
| PROBE | DESCRIPTION (from dataset) | GENE SYMBOL | GENE_TITLE | RANK IN GENE LIST | RANK METRIC SCORE | RUNNING ES | CORE ENRICHMENT | |
|---|---|---|---|---|---|---|---|---|
| 1 | FGD6 | 610632 | 3286 | 0.361 | -0.1512 | No | ||
| 2 | CDC42EP2 | 540079 2970138 | 4220 | 0.144 | -0.1913 | No | ||
| 3 | FGD4 | 520168 870411 2640253 6550338 6650364 | 6015 | 0.039 | -0.2850 | No | ||
| 4 | CDC42EP5 | 6400397 | 6424 | 0.029 | -0.3049 | No | ||
| 5 | TAOK2 | 110575 6380692 | 10330 | -0.043 | -0.5117 | No | ||
| 6 | FGD5 | 3520438 4060500 | 11337 | -0.069 | -0.5609 | No | ||
| 7 | CDC42EP1 | 6550279 6370215 4060450 4590066 | 13106 | -0.159 | -0.6448 | No | ||
| 8 | CENTD2 | 60408 2510156 6100494 | 14505 | -0.332 | -0.6965 | No | ||
| 9 | FGD2 | 5340195 | 16443 | -1.089 | -0.7240 | Yes | ||
| 10 | FGD3 | 5690465 | 16660 | -1.236 | -0.6486 | Yes | ||
| 11 | FGD1 | 4780021 | 16750 | -1.302 | -0.5618 | Yes | ||
| 12 | MYH9 | 3120091 4850292 | 18242 | -2.994 | -0.4312 | Yes | ||
| 13 | CDC42EP4 | 4150338 | 18610 | -6.410 | 0.0003 | Yes |