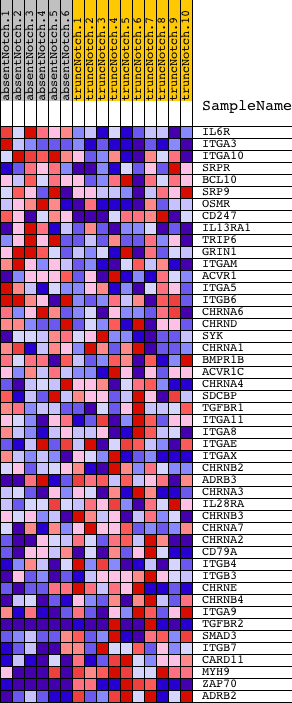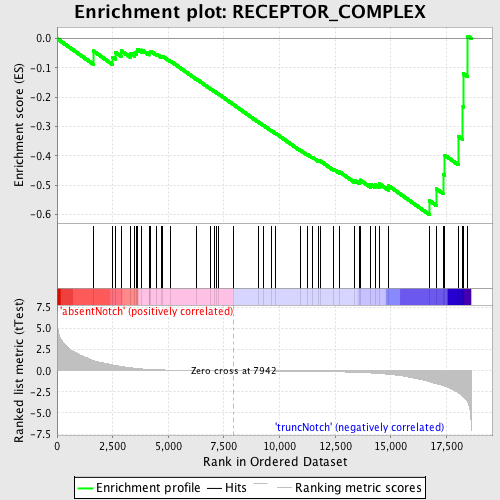
Profile of the Running ES Score & Positions of GeneSet Members on the Rank Ordered List
| Dataset | Set_03_absentNotch_versus_truncNotch.phenotype_absentNotch_versus_truncNotch.cls #absentNotch_versus_truncNotch.phenotype_absentNotch_versus_truncNotch.cls #absentNotch_versus_truncNotch_repos |
| Phenotype | phenotype_absentNotch_versus_truncNotch.cls#absentNotch_versus_truncNotch_repos |
| Upregulated in class | truncNotch |
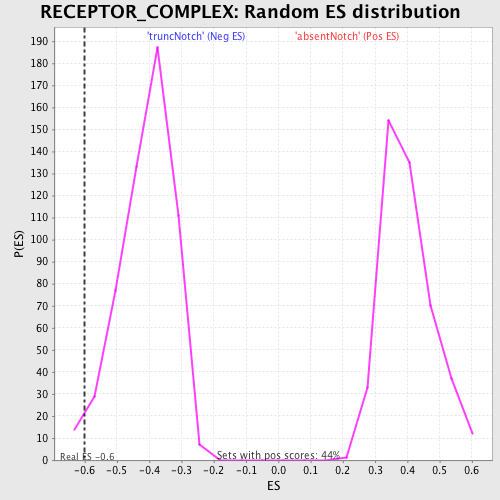
| GeneSet | RECEPTOR_COMPLEX |
| Enrichment Score (ES) | -0.6003396 |
| Normalized Enrichment Score (NES) | -1.4684025 |
| Nominal p-value | 0.025089607 |
| FDR q-value | 1.0 |
| FWER p-Value | 1.0 |
| PROBE | DESCRIPTION (from dataset) | GENE SYMBOL | GENE_TITLE | RANK IN GENE LIST | RANK METRIC SCORE | RUNNING ES | CORE ENRICHMENT | |
|---|---|---|---|---|---|---|---|---|
| 1 | IL6R | 520706 3800215 | 1627 | 1.219 | -0.0420 | No | ||
| 2 | ITGA3 | 4570427 | 2500 | 0.675 | -0.0637 | No | ||
| 3 | ITGA10 | 6330438 | 2616 | 0.624 | -0.0466 | No | ||
| 4 | SRPR | 6590647 6370114 | 2878 | 0.507 | -0.0416 | No | ||
| 5 | BCL10 | 2360397 | 3285 | 0.361 | -0.0500 | No | ||
| 6 | SRP9 | 3170053 4540538 | 3479 | 0.300 | -0.0492 | No | ||
| 7 | OSMR | 1990519 | 3587 | 0.270 | -0.0448 | No | ||
| 8 | CD247 | 3800725 5720136 | 3605 | 0.264 | -0.0359 | No | ||
| 9 | IL13RA1 | 5550609 | 3812 | 0.214 | -0.0389 | No | ||
| 10 | TRIP6 | 6520609 | 4131 | 0.157 | -0.0502 | No | ||
| 11 | GRIN1 | 3800014 7000609 | 4164 | 0.152 | -0.0462 | No | ||
| 12 | ITGAM | 1190373 | 4215 | 0.144 | -0.0435 | No | ||
| 13 | ACVR1 | 6840671 | 4475 | 0.115 | -0.0532 | No | ||
| 14 | ITGA5 | 5550520 | 4682 | 0.098 | -0.0606 | No | ||
| 15 | ITGB6 | 2810068 4570332 | 4735 | 0.094 | -0.0599 | No | ||
| 16 | CHRNA6 | 5340092 | 5100 | 0.072 | -0.0768 | No | ||
| 17 | CHRND | 840403 2260670 | 6257 | 0.033 | -0.1378 | No | ||
| 18 | SYK | 6940133 | 6907 | 0.018 | -0.1721 | No | ||
| 19 | CHRNA1 | 1170025 3610364 5220292 | 7067 | 0.016 | -0.1801 | No | ||
| 20 | BMPR1B | 4560010 4760121 6450161 | 7184 | 0.013 | -0.1858 | No | ||
| 21 | ACVR1C | 5890044 | 7249 | 0.012 | -0.1888 | No | ||
| 22 | CHRNA4 | 730075 2680091 | 7913 | 0.000 | -0.2245 | No | ||
| 23 | SDCBP | 460487 2190039 5270441 | 9039 | -0.018 | -0.2844 | No | ||
| 24 | TGFBR1 | 1400148 4280020 6550711 | 9267 | -0.022 | -0.2958 | No | ||
| 25 | ITGA11 | 1740112 6590110 | 9636 | -0.029 | -0.3145 | No | ||
| 26 | ITGA8 | 4050086 | 9836 | -0.033 | -0.3240 | No | ||
| 27 | ITGAE | 4210632 4670239 5340253 5420746 5690154 5700685 6770154 | 10940 | -0.058 | -0.3813 | No | ||
| 28 | ITGAX | 6130524 | 11243 | -0.065 | -0.3951 | No | ||
| 29 | CHRNB2 | 580204 3120739 | 11476 | -0.073 | -0.4048 | No | ||
| 30 | ADRB3 | 6900072 | 11749 | -0.082 | -0.4164 | No | ||
| 31 | CHRNA3 | 6760100 | 11821 | -0.085 | -0.4170 | No | ||
| 32 | IL28RA | 3710072 4920242 | 12434 | -0.114 | -0.4457 | No | ||
| 33 | CHRNB3 | 430441 870725 5720204 | 12701 | -0.129 | -0.4552 | No | ||
| 34 | CHRNA7 | 2970446 | 13366 | -0.179 | -0.4843 | No | ||
| 35 | CHRNA2 | 5050315 | 13590 | -0.205 | -0.4886 | No | ||
| 36 | CD79A | 3450563 | 13623 | -0.208 | -0.4826 | No | ||
| 37 | ITGB4 | 1740021 3840482 | 14098 | -0.265 | -0.4982 | No | ||
| 38 | ITGB3 | 5270463 | 14293 | -0.296 | -0.4976 | No | ||
| 39 | CHRNE | 3190170 | 14493 | -0.331 | -0.4959 | No | ||
| 40 | CHRNB4 | 6370110 | 14908 | -0.415 | -0.5026 | No | ||
| 41 | ITGA9 | 670180 | 16723 | -1.281 | -0.5524 | Yes | ||
| 42 | TGFBR2 | 1780711 1980537 6550398 | 17052 | -1.525 | -0.5130 | Yes | ||
| 43 | SMAD3 | 6450671 | 17349 | -1.764 | -0.4629 | Yes | ||
| 44 | ITGB7 | 4670619 | 17429 | -1.843 | -0.3982 | Yes | ||
| 45 | CARD11 | 70338 | 18030 | -2.591 | -0.3336 | Yes | ||
| 46 | MYH9 | 3120091 4850292 | 18242 | -2.994 | -0.2329 | Yes | ||
| 47 | ZAP70 | 1410494 2260504 | 18258 | -3.049 | -0.1197 | Yes | ||
| 48 | ADRB2 | 3290373 | 18460 | -3.712 | 0.0084 | Yes |