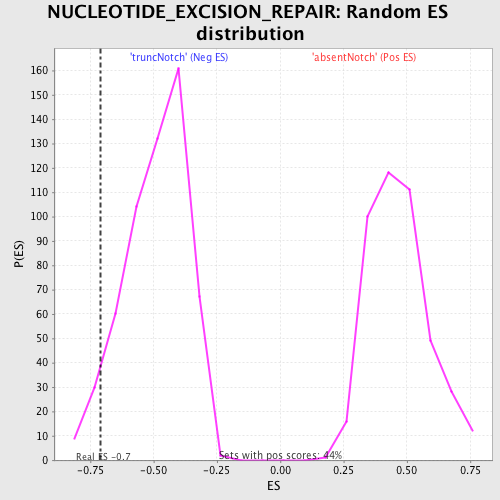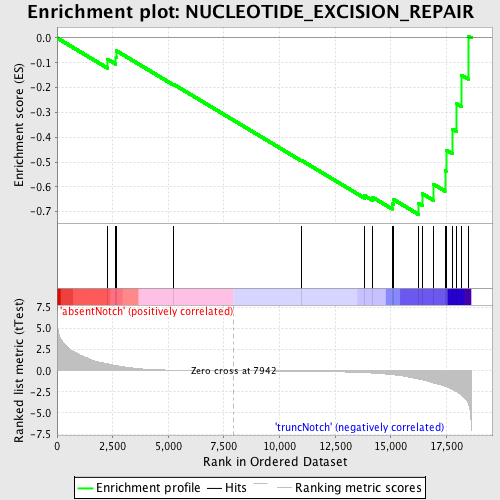
Profile of the Running ES Score & Positions of GeneSet Members on the Rank Ordered List
| Dataset | Set_03_absentNotch_versus_truncNotch.phenotype_absentNotch_versus_truncNotch.cls #absentNotch_versus_truncNotch.phenotype_absentNotch_versus_truncNotch.cls #absentNotch_versus_truncNotch_repos |
| Phenotype | phenotype_absentNotch_versus_truncNotch.cls#absentNotch_versus_truncNotch_repos |
| Upregulated in class | truncNotch |
| GeneSet | NUCLEOTIDE_EXCISION_REPAIR |
| Enrichment Score (ES) | -0.7114942 |
| Normalized Enrichment Score (NES) | -1.4514978 |
| Nominal p-value | 0.053097345 |
| FDR q-value | 1.0 |
| FWER p-Value | 1.0 |
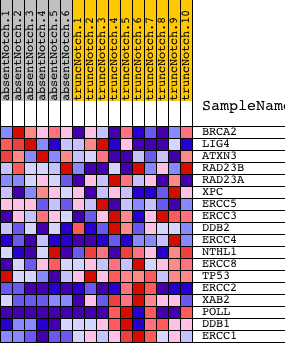
| PROBE | DESCRIPTION (from dataset) | GENE SYMBOL | GENE_TITLE | RANK IN GENE LIST | RANK METRIC SCORE | RUNNING ES | CORE ENRICHMENT | |
|---|---|---|---|---|---|---|---|---|
| 1 | BRCA2 | 4280372 | 2264 | 0.810 | -0.0853 | No | ||
| 2 | LIG4 | 6660035 | 2645 | 0.613 | -0.0782 | No | ||
| 3 | ATXN3 | 50156 2900095 | 2654 | 0.611 | -0.0511 | No | ||
| 4 | RAD23B | 2190671 | 5234 | 0.065 | -0.1869 | No | ||
| 5 | RAD23A | 670082 5270309 5360463 5550364 | 10978 | -0.058 | -0.4930 | No | ||
| 6 | XPC | 6370193 | 13823 | -0.231 | -0.6356 | No | ||
| 7 | ERCC5 | 770025 4540692 | 14164 | -0.275 | -0.6415 | No | ||
| 8 | ERCC3 | 6900008 | 15060 | -0.456 | -0.6691 | Yes | ||
| 9 | DDB2 | 3520341 4610168 4850184 4920717 | 15132 | -0.473 | -0.6516 | Yes | ||
| 10 | ERCC4 | 1570619 5720180 | 16247 | -0.987 | -0.6671 | Yes | ||
| 11 | NTHL1 | 4920148 | 16423 | -1.078 | -0.6281 | Yes | ||
| 12 | ERCC8 | 1240300 6450372 6590180 | 16910 | -1.448 | -0.5891 | Yes | ||
| 13 | TP53 | 6130707 | 17437 | -1.852 | -0.5341 | Yes | ||
| 14 | ERCC2 | 2360750 4060390 6550138 | 17484 | -1.888 | -0.4517 | Yes | ||
| 15 | XAB2 | 60110 | 17780 | -2.224 | -0.3675 | Yes | ||
| 16 | POLL | 5910673 6350672 | 17962 | -2.486 | -0.2655 | Yes | ||
| 17 | DDB1 | 6110687 | 18174 | -2.829 | -0.1496 | Yes | ||
| 18 | ERCC1 | 3800010 4590132 4670397 | 18479 | -3.855 | 0.0074 | Yes |