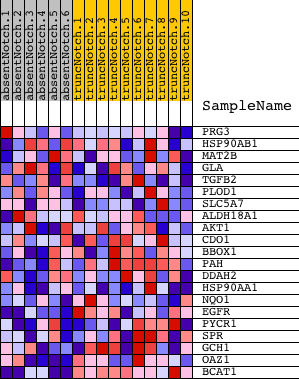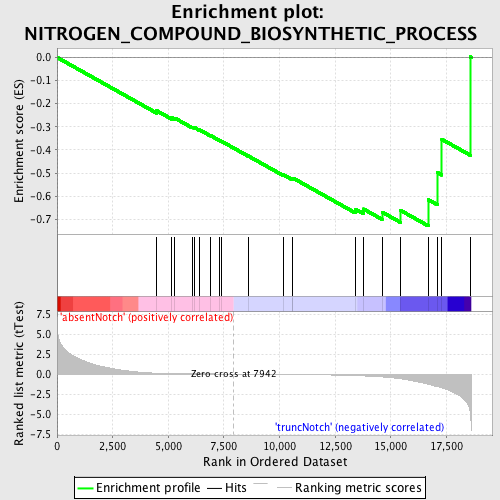
Profile of the Running ES Score & Positions of GeneSet Members on the Rank Ordered List
| Dataset | Set_03_absentNotch_versus_truncNotch.phenotype_absentNotch_versus_truncNotch.cls #absentNotch_versus_truncNotch.phenotype_absentNotch_versus_truncNotch.cls #absentNotch_versus_truncNotch_repos |
| Phenotype | phenotype_absentNotch_versus_truncNotch.cls#absentNotch_versus_truncNotch_repos |
| Upregulated in class | truncNotch |
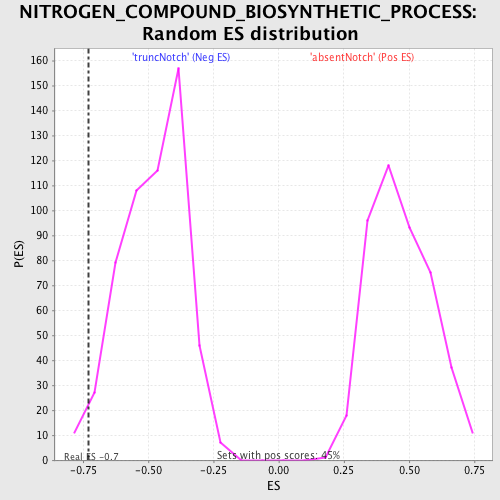
| GeneSet | NITROGEN_COMPOUND_BIOSYNTHETIC_PROCESS |
| Enrichment Score (ES) | -0.7283754 |
| Normalized Enrichment Score (NES) | -1.5196662 |
| Nominal p-value | 0.025408348 |
| FDR q-value | 0.9906911 |
| FWER p-Value | 1.0 |
| PROBE | DESCRIPTION (from dataset) | GENE SYMBOL | GENE_TITLE | RANK IN GENE LIST | RANK METRIC SCORE | RUNNING ES | CORE ENRICHMENT | |
|---|---|---|---|---|---|---|---|---|
| 1 | PRG3 | 6220020 | 4477 | 0.115 | -0.2304 | No | ||
| 2 | HSP90AB1 | 3170358 5390102 6040093 | 5159 | 0.068 | -0.2609 | No | ||
| 3 | MAT2B | 1690139 2510706 | 5295 | 0.063 | -0.2625 | No | ||
| 4 | GLA | 4610364 | 6072 | 0.038 | -0.3009 | No | ||
| 5 | TGFB2 | 4920292 | 6193 | 0.034 | -0.3043 | No | ||
| 6 | PLOD1 | 6040427 | 6398 | 0.029 | -0.3126 | No | ||
| 7 | SLC5A7 | 4760091 | 6902 | 0.018 | -0.3380 | No | ||
| 8 | ALDH18A1 | 2340601 | 7276 | 0.011 | -0.3571 | No | ||
| 9 | AKT1 | 5290746 | 7382 | 0.010 | -0.3619 | No | ||
| 10 | CDO1 | 2480279 | 8582 | -0.011 | -0.4254 | No | ||
| 11 | BBOX1 | 2030538 2370452 | 10153 | -0.040 | -0.5062 | No | ||
| 12 | PAH | 3800309 | 10587 | -0.050 | -0.5250 | No | ||
| 13 | DDAH2 | 4480551 | 10599 | -0.050 | -0.5212 | No | ||
| 14 | HSP90AA1 | 4560041 5220133 2120722 | 13408 | -0.182 | -0.6559 | No | ||
| 15 | NQO1 | 3450136 6840121 | 13769 | -0.226 | -0.6550 | No | ||
| 16 | EGFR | 4920138 6480521 | 14611 | -0.351 | -0.6686 | Yes | ||
| 17 | PYCR1 | 6180670 | 15427 | -0.579 | -0.6605 | Yes | ||
| 18 | SPR | 6840170 | 16690 | -1.259 | -0.6153 | Yes | ||
| 19 | GCH1 | 670364 6550358 | 17089 | -1.551 | -0.4974 | Yes | ||
| 20 | OAZ1 | 110181 | 17293 | -1.720 | -0.3540 | Yes | ||
| 21 | BCAT1 | 3290128 4050408 | 18570 | -4.735 | 0.0025 | Yes |