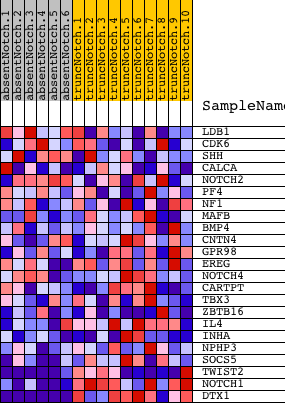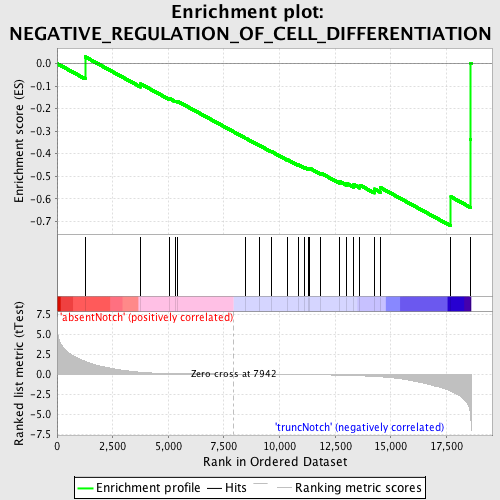
Profile of the Running ES Score & Positions of GeneSet Members on the Rank Ordered List
| Dataset | Set_03_absentNotch_versus_truncNotch.phenotype_absentNotch_versus_truncNotch.cls #absentNotch_versus_truncNotch.phenotype_absentNotch_versus_truncNotch.cls #absentNotch_versus_truncNotch_repos |
| Phenotype | phenotype_absentNotch_versus_truncNotch.cls#absentNotch_versus_truncNotch_repos |
| Upregulated in class | truncNotch |
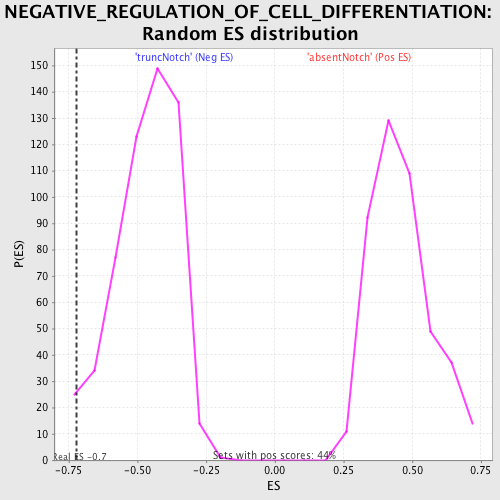
| GeneSet | NEGATIVE_REGULATION_OF_CELL_DIFFERENTIATION |
| Enrichment Score (ES) | -0.7209783 |
| Normalized Enrichment Score (NES) | -1.5412097 |
| Nominal p-value | 0.017889088 |
| FDR q-value | 1.0 |
| FWER p-Value | 1.0 |
| PROBE | DESCRIPTION (from dataset) | GENE SYMBOL | GENE_TITLE | RANK IN GENE LIST | RANK METRIC SCORE | RUNNING ES | CORE ENRICHMENT | |
|---|---|---|---|---|---|---|---|---|
| 1 | LDB1 | 5270601 | 1263 | 1.597 | 0.0300 | No | ||
| 2 | CDK6 | 4920253 | 3755 | 0.226 | -0.0901 | No | ||
| 3 | SHH | 5570400 | 5066 | 0.073 | -0.1561 | No | ||
| 4 | CALCA | 5860167 | 5324 | 0.062 | -0.1661 | No | ||
| 5 | NOTCH2 | 2570397 | 5411 | 0.058 | -0.1672 | No | ||
| 6 | PF4 | 6130332 | 8482 | -0.009 | -0.3317 | No | ||
| 7 | NF1 | 6980433 | 9084 | -0.019 | -0.3629 | No | ||
| 8 | MAFB | 1230471 | 9621 | -0.029 | -0.3900 | No | ||
| 9 | BMP4 | 380113 | 10348 | -0.044 | -0.4263 | No | ||
| 10 | CNTN4 | 1780300 5570577 6370019 | 10830 | -0.055 | -0.4488 | No | ||
| 11 | GPR98 | 6400647 | 11116 | -0.062 | -0.4604 | No | ||
| 12 | EREG | 50519 4920129 | 11287 | -0.067 | -0.4654 | No | ||
| 13 | NOTCH4 | 2450040 6370707 | 11364 | -0.070 | -0.4652 | No | ||
| 14 | CARTPT | 6660687 | 11850 | -0.086 | -0.4860 | No | ||
| 15 | TBX3 | 2570672 | 12682 | -0.128 | -0.5228 | No | ||
| 16 | ZBTB16 | 3290022 | 13022 | -0.152 | -0.5317 | No | ||
| 17 | IL4 | 6020537 | 13337 | -0.177 | -0.5378 | No | ||
| 18 | INHA | 6100102 | 13613 | -0.206 | -0.5399 | No | ||
| 19 | NPHP3 | 2450497 7050731 | 14259 | -0.291 | -0.5567 | No | ||
| 20 | SOCS5 | 3830398 7100093 | 14544 | -0.339 | -0.5512 | No | ||
| 21 | TWIST2 | 6760433 | 17702 | -2.112 | -0.5915 | Yes | ||
| 22 | NOTCH1 | 3390114 | 18581 | -4.954 | -0.3351 | Yes | ||
| 23 | DTX1 | 5900372 | 18593 | -5.496 | 0.0012 | Yes |